Immigrants from Haiti vs Barbadian Single Female Poverty
COMPARE
Immigrants from Haiti
Barbadian
Single Female Poverty
Single Female Poverty Comparison
Immigrants from Haiti
Barbadians
21.5%
SINGLE FEMALE POVERTY
18.8/ 100
METRIC RATING
203rd/ 347
METRIC RANK
21.8%
SINGLE FEMALE POVERTY
7.2/ 100
METRIC RATING
224th/ 347
METRIC RANK
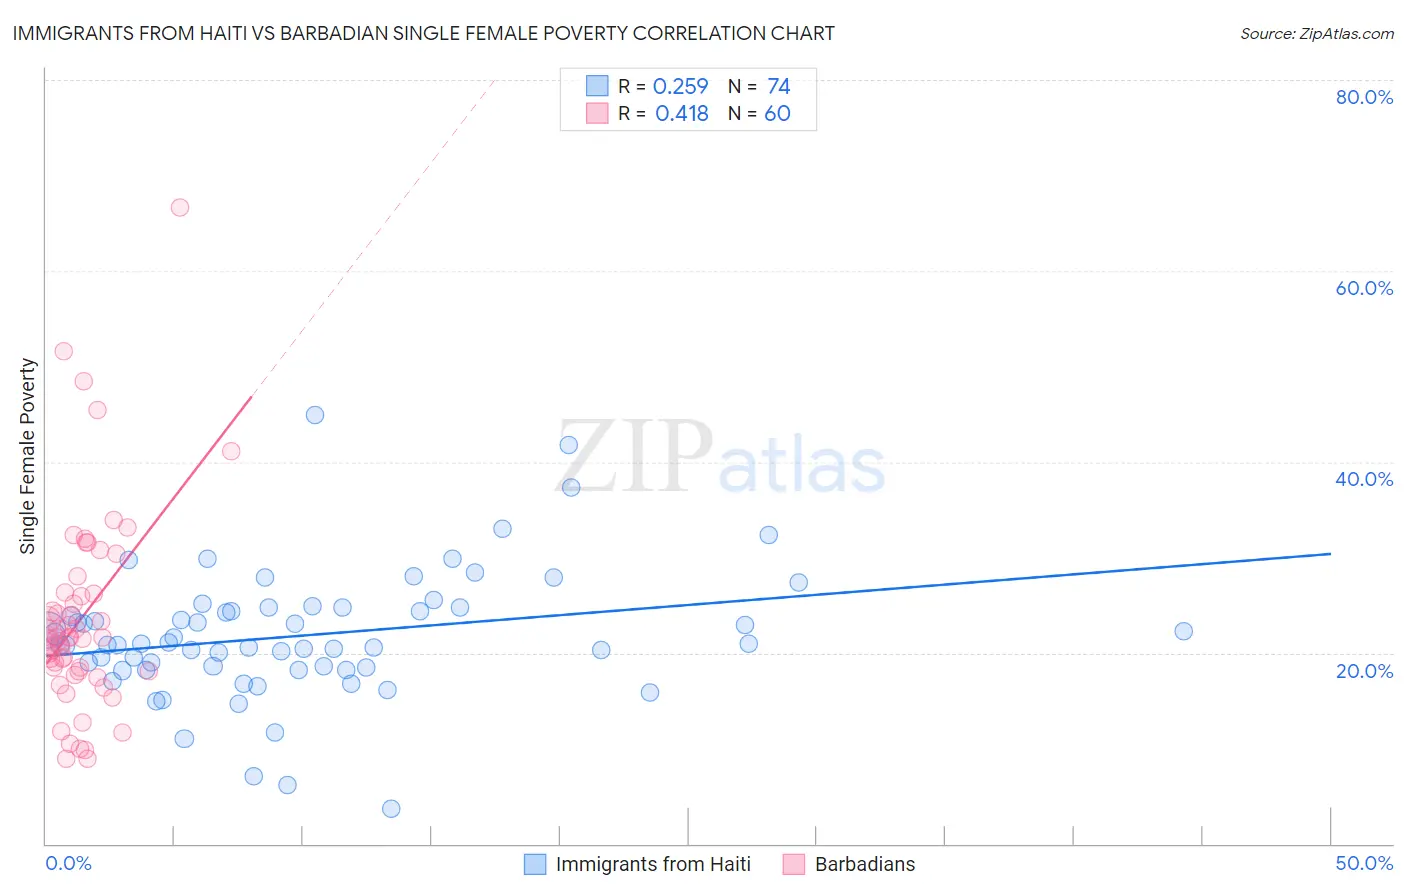
Immigrants from Haiti vs Barbadian Single Female Poverty Correlation Chart
The statistical analysis conducted on geographies consisting of 223,147,681 people shows a weak positive correlation between the proportion of Immigrants from Haiti and poverty level among single females in the United States with a correlation coefficient (R) of 0.259 and weighted average of 21.5%. Similarly, the statistical analysis conducted on geographies consisting of 140,678,915 people shows a moderate positive correlation between the proportion of Barbadians and poverty level among single females in the United States with a correlation coefficient (R) of 0.418 and weighted average of 21.8%, a difference of 1.7%.
Single Female Poverty Correlation Summary
| Measurement | Immigrants from Haiti | Barbadian |
| Minimum | 3.7% | 8.9% |
| Maximum | 45.0% | 66.7% |
| Range | 41.2% | 57.8% |
| Mean | 21.8% | 23.6% |
| Median | 20.9% | 21.6% |
| Interquartile 25% (IQ1) | 18.5% | 18.1% |
| Interquartile 75% (IQ3) | 24.7% | 26.3% |
| Interquartile Range (IQR) | 6.2% | 8.1% |
| Standard Deviation (Sample) | 6.8% | 10.6% |
| Standard Deviation (Population) | 6.7% | 10.5% |
Similar Demographics by Single Female Poverty
Demographics Similar to Immigrants from Haiti by Single Female Poverty
In terms of single female poverty, the demographic groups most similar to Immigrants from Haiti are Immigrants from Kenya (21.4%, a difference of 0.18%), Nigerian (21.4%, a difference of 0.20%), Immigrants from Africa (21.5%, a difference of 0.21%), Irish (21.4%, a difference of 0.25%), and Finnish (21.5%, a difference of 0.27%).
| Demographics | Rating | Rank | Single Female Poverty |
| Immigrants | Saudi Arabia | 27.1 /100 | #196 | Fair 21.3% |
| Japanese | 26.4 /100 | #197 | Fair 21.3% |
| Swiss | 24.2 /100 | #198 | Fair 21.4% |
| Immigrants | Immigrants | 22.0 /100 | #199 | Fair 21.4% |
| Irish | 21.4 /100 | #200 | Fair 21.4% |
| Nigerians | 20.9 /100 | #201 | Fair 21.4% |
| Immigrants | Kenya | 20.7 /100 | #202 | Fair 21.4% |
| Immigrants | Haiti | 18.8 /100 | #203 | Poor 21.5% |
| Immigrants | Africa | 16.7 /100 | #204 | Poor 21.5% |
| Finns | 16.2 /100 | #205 | Poor 21.5% |
| Belgians | 16.1 /100 | #206 | Poor 21.5% |
| Ghanaians | 15.7 /100 | #207 | Poor 21.6% |
| Haitians | 15.4 /100 | #208 | Poor 21.6% |
| Immigrants | Eastern Africa | 15.1 /100 | #209 | Poor 21.6% |
| Immigrants | Panama | 14.4 /100 | #210 | Poor 21.6% |
Demographics Similar to Barbadians by Single Female Poverty
In terms of single female poverty, the demographic groups most similar to Barbadians are Scottish (21.8%, a difference of 0.020%), Immigrants from Eritrea (21.8%, a difference of 0.16%), Immigrants from Grenada (21.8%, a difference of 0.17%), English (21.9%, a difference of 0.18%), and German (21.8%, a difference of 0.23%).
| Demographics | Rating | Rank | Single Female Poverty |
| Immigrants | St. Vincent and the Grenadines | 11.7 /100 | #217 | Poor 21.7% |
| Nepalese | 9.7 /100 | #218 | Tragic 21.7% |
| Panamanians | 9.4 /100 | #219 | Tragic 21.7% |
| Germans | 8.3 /100 | #220 | Tragic 21.8% |
| Immigrants | Grenada | 8.0 /100 | #221 | Tragic 21.8% |
| Immigrants | Eritrea | 7.9 /100 | #222 | Tragic 21.8% |
| Scottish | 7.3 /100 | #223 | Tragic 21.8% |
| Barbadians | 7.2 /100 | #224 | Tragic 21.8% |
| English | 6.4 /100 | #225 | Tragic 21.9% |
| Immigrants | Portugal | 5.8 /100 | #226 | Tragic 21.9% |
| Immigrants | Ghana | 5.8 /100 | #227 | Tragic 21.9% |
| Salvadorans | 5.5 /100 | #228 | Tragic 21.9% |
| Tlingit-Haida | 5.4 /100 | #229 | Tragic 21.9% |
| Immigrants | Western Africa | 5.3 /100 | #230 | Tragic 22.0% |
| Welsh | 5.0 /100 | #231 | Tragic 22.0% |