Immigrants from Oceania vs Barbadian Single Female Poverty
COMPARE
Immigrants from Oceania
Barbadian
Single Female Poverty
Single Female Poverty Comparison
Immigrants from Oceania
Barbadians
20.7%
SINGLE FEMALE POVERTY
74.3/ 100
METRIC RATING
157th/ 347
METRIC RANK
21.8%
SINGLE FEMALE POVERTY
7.2/ 100
METRIC RATING
224th/ 347
METRIC RANK
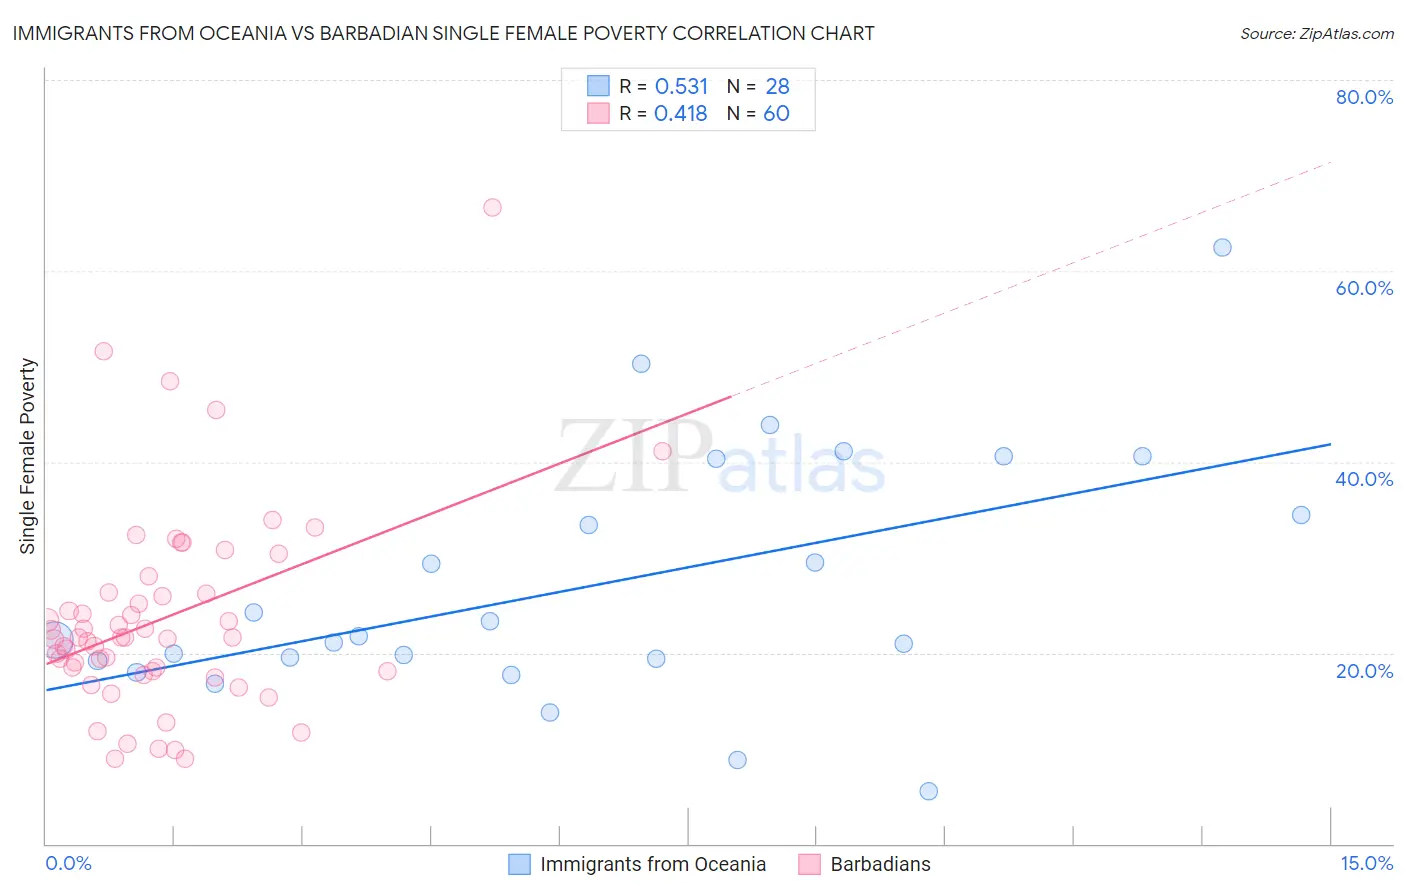
Immigrants from Oceania vs Barbadian Single Female Poverty Correlation Chart
The statistical analysis conducted on geographies consisting of 301,448,754 people shows a substantial positive correlation between the proportion of Immigrants from Oceania and poverty level among single females in the United States with a correlation coefficient (R) of 0.531 and weighted average of 20.7%. Similarly, the statistical analysis conducted on geographies consisting of 140,678,915 people shows a moderate positive correlation between the proportion of Barbadians and poverty level among single females in the United States with a correlation coefficient (R) of 0.418 and weighted average of 21.8%, a difference of 5.7%.
Single Female Poverty Correlation Summary
| Measurement | Immigrants from Oceania | Barbadian |
| Minimum | 5.6% | 8.9% |
| Maximum | 62.5% | 66.7% |
| Range | 56.9% | 57.8% |
| Mean | 27.0% | 23.6% |
| Median | 21.6% | 21.6% |
| Interquartile 25% (IQ1) | 19.3% | 18.1% |
| Interquartile 75% (IQ3) | 37.4% | 26.3% |
| Interquartile Range (IQR) | 18.1% | 8.1% |
| Standard Deviation (Sample) | 13.1% | 10.6% |
| Standard Deviation (Population) | 12.8% | 10.5% |
Similar Demographics by Single Female Poverty
Demographics Similar to Immigrants from Oceania by Single Female Poverty
In terms of single female poverty, the demographic groups most similar to Immigrants from Oceania are Danish (20.7%, a difference of 0.11%), South American Indian (20.6%, a difference of 0.12%), Samoan (20.6%, a difference of 0.15%), Costa Rican (20.7%, a difference of 0.20%), and Immigrants from Western Europe (20.6%, a difference of 0.21%).
| Demographics | Rating | Rank | Single Female Poverty |
| Immigrants | Denmark | 80.5 /100 | #150 | Excellent 20.5% |
| Puget Sound Salish | 79.6 /100 | #151 | Good 20.6% |
| Immigrants | Uruguay | 77.7 /100 | #152 | Good 20.6% |
| Swedes | 77.1 /100 | #153 | Good 20.6% |
| Immigrants | Western Europe | 76.7 /100 | #154 | Good 20.6% |
| Samoans | 76.0 /100 | #155 | Good 20.6% |
| South American Indians | 75.7 /100 | #156 | Good 20.6% |
| Immigrants | Oceania | 74.3 /100 | #157 | Good 20.7% |
| Danes | 73.0 /100 | #158 | Good 20.7% |
| Costa Ricans | 71.8 /100 | #159 | Good 20.7% |
| Arabs | 70.8 /100 | #160 | Good 20.7% |
| Kenyans | 68.5 /100 | #161 | Good 20.8% |
| Northern Europeans | 68.4 /100 | #162 | Good 20.8% |
| Lebanese | 67.6 /100 | #163 | Good 20.8% |
| Iraqis | 64.5 /100 | #164 | Good 20.8% |
Demographics Similar to Barbadians by Single Female Poverty
In terms of single female poverty, the demographic groups most similar to Barbadians are Scottish (21.8%, a difference of 0.020%), Immigrants from Eritrea (21.8%, a difference of 0.16%), Immigrants from Grenada (21.8%, a difference of 0.17%), English (21.9%, a difference of 0.18%), and German (21.8%, a difference of 0.23%).
| Demographics | Rating | Rank | Single Female Poverty |
| Immigrants | St. Vincent and the Grenadines | 11.7 /100 | #217 | Poor 21.7% |
| Nepalese | 9.7 /100 | #218 | Tragic 21.7% |
| Panamanians | 9.4 /100 | #219 | Tragic 21.7% |
| Germans | 8.3 /100 | #220 | Tragic 21.8% |
| Immigrants | Grenada | 8.0 /100 | #221 | Tragic 21.8% |
| Immigrants | Eritrea | 7.9 /100 | #222 | Tragic 21.8% |
| Scottish | 7.3 /100 | #223 | Tragic 21.8% |
| Barbadians | 7.2 /100 | #224 | Tragic 21.8% |
| English | 6.4 /100 | #225 | Tragic 21.9% |
| Immigrants | Portugal | 5.8 /100 | #226 | Tragic 21.9% |
| Immigrants | Ghana | 5.8 /100 | #227 | Tragic 21.9% |
| Salvadorans | 5.5 /100 | #228 | Tragic 21.9% |
| Tlingit-Haida | 5.4 /100 | #229 | Tragic 21.9% |
| Immigrants | Western Africa | 5.3 /100 | #230 | Tragic 22.0% |
| Welsh | 5.0 /100 | #231 | Tragic 22.0% |