Senegalese vs Syrian Male Poverty
COMPARE
Senegalese
Syrian
Male Poverty
Male Poverty Comparison
Senegalese
Syrians
14.1%
MALE POVERTY
0.0/ 100
METRIC RATING
304th/ 347
METRIC RANK
10.9%
MALE POVERTY
71.4/ 100
METRIC RATING
146th/ 347
METRIC RANK
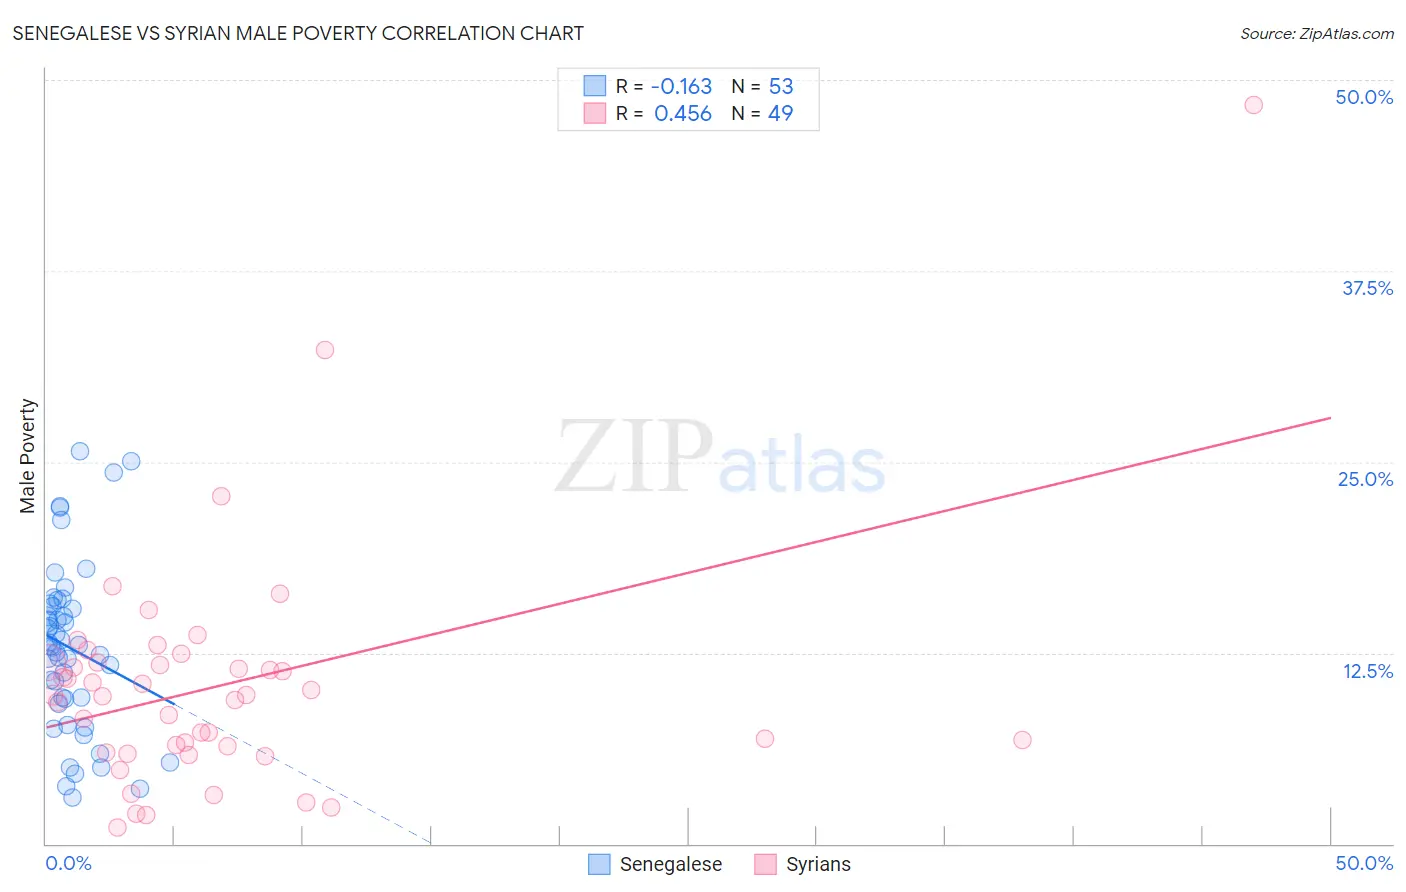
Senegalese vs Syrian Male Poverty Correlation Chart
The statistical analysis conducted on geographies consisting of 78,114,751 people shows a poor negative correlation between the proportion of Senegalese and poverty level among males in the United States with a correlation coefficient (R) of -0.163 and weighted average of 14.1%. Similarly, the statistical analysis conducted on geographies consisting of 266,155,974 people shows a moderate positive correlation between the proportion of Syrians and poverty level among males in the United States with a correlation coefficient (R) of 0.456 and weighted average of 10.9%, a difference of 28.6%.
Male Poverty Correlation Summary
| Measurement | Senegalese | Syrian |
| Minimum | 3.1% | 1.0% |
| Maximum | 25.7% | 48.3% |
| Range | 22.6% | 47.3% |
| Mean | 12.8% | 10.4% |
| Median | 13.0% | 9.7% |
| Interquartile 25% (IQ1) | 9.3% | 6.2% |
| Interquartile 75% (IQ3) | 15.6% | 11.8% |
| Interquartile Range (IQR) | 6.3% | 5.7% |
| Standard Deviation (Sample) | 5.5% | 7.8% |
| Standard Deviation (Population) | 5.4% | 7.7% |
Similar Demographics by Male Poverty
Demographics Similar to Senegalese by Male Poverty
In terms of male poverty, the demographic groups most similar to Senegalese are Bahamian (14.1%, a difference of 0.10%), Immigrants from Caribbean (14.0%, a difference of 0.14%), Immigrants from Senegal (14.0%, a difference of 0.20%), Immigrants from Bangladesh (14.1%, a difference of 0.21%), and Immigrants from Mexico (14.0%, a difference of 0.27%).
| Demographics | Rating | Rank | Male Poverty |
| Inupiat | 0.0 /100 | #297 | Tragic 14.0% |
| Blackfeet | 0.0 /100 | #298 | Tragic 14.0% |
| Immigrants | Guatemala | 0.0 /100 | #299 | Tragic 14.0% |
| Immigrants | Mexico | 0.0 /100 | #300 | Tragic 14.0% |
| Immigrants | Senegal | 0.0 /100 | #301 | Tragic 14.0% |
| Immigrants | Caribbean | 0.0 /100 | #302 | Tragic 14.0% |
| Bahamians | 0.0 /100 | #303 | Tragic 14.1% |
| Senegalese | 0.0 /100 | #304 | Tragic 14.1% |
| Immigrants | Bangladesh | 0.0 /100 | #305 | Tragic 14.1% |
| Creek | 0.0 /100 | #306 | Tragic 14.1% |
| Dutch West Indians | 0.0 /100 | #307 | Tragic 14.2% |
| Africans | 0.0 /100 | #308 | Tragic 14.2% |
| Somalis | 0.0 /100 | #309 | Tragic 14.3% |
| Seminole | 0.0 /100 | #310 | Tragic 14.3% |
| Hondurans | 0.0 /100 | #311 | Tragic 14.3% |
Demographics Similar to Syrians by Male Poverty
In terms of male poverty, the demographic groups most similar to Syrians are Immigrants from Germany (10.9%, a difference of 0.030%), Samoan (10.9%, a difference of 0.050%), Afghan (10.9%, a difference of 0.070%), Icelander (11.0%, a difference of 0.34%), and Armenian (11.0%, a difference of 0.40%).
| Demographics | Rating | Rank | Male Poverty |
| Immigrants | Jordan | 77.5 /100 | #139 | Good 10.8% |
| Tlingit-Haida | 76.1 /100 | #140 | Good 10.9% |
| Immigrants | France | 75.8 /100 | #141 | Good 10.9% |
| Basques | 74.6 /100 | #142 | Good 10.9% |
| Afghans | 71.9 /100 | #143 | Good 10.9% |
| Samoans | 71.8 /100 | #144 | Good 10.9% |
| Immigrants | Germany | 71.6 /100 | #145 | Good 10.9% |
| Syrians | 71.4 /100 | #146 | Good 10.9% |
| Icelanders | 68.5 /100 | #147 | Good 11.0% |
| Armenians | 68.0 /100 | #148 | Good 11.0% |
| Immigrants | Venezuela | 67.9 /100 | #149 | Good 11.0% |
| Guamanians/Chamorros | 67.6 /100 | #150 | Good 11.0% |
| Venezuelans | 67.4 /100 | #151 | Good 11.0% |
| Immigrants | Nepal | 67.3 /100 | #152 | Good 11.0% |
| Immigrants | Bosnia and Herzegovina | 65.2 /100 | #153 | Good 11.0% |