Senegalese vs Syrian Births to Unmarried Women
COMPARE
Senegalese
Syrian
Births to Unmarried Women
Births to Unmarried Women Comparison
Senegalese
Syrians
36.8%
BIRTHS TO UNMARRIED WOMEN
0.1/ 100
METRIC RATING
269th/ 347
METRIC RANK
30.2%
BIRTHS TO UNMARRIED WOMEN
88.2/ 100
METRIC RATING
123rd/ 347
METRIC RANK
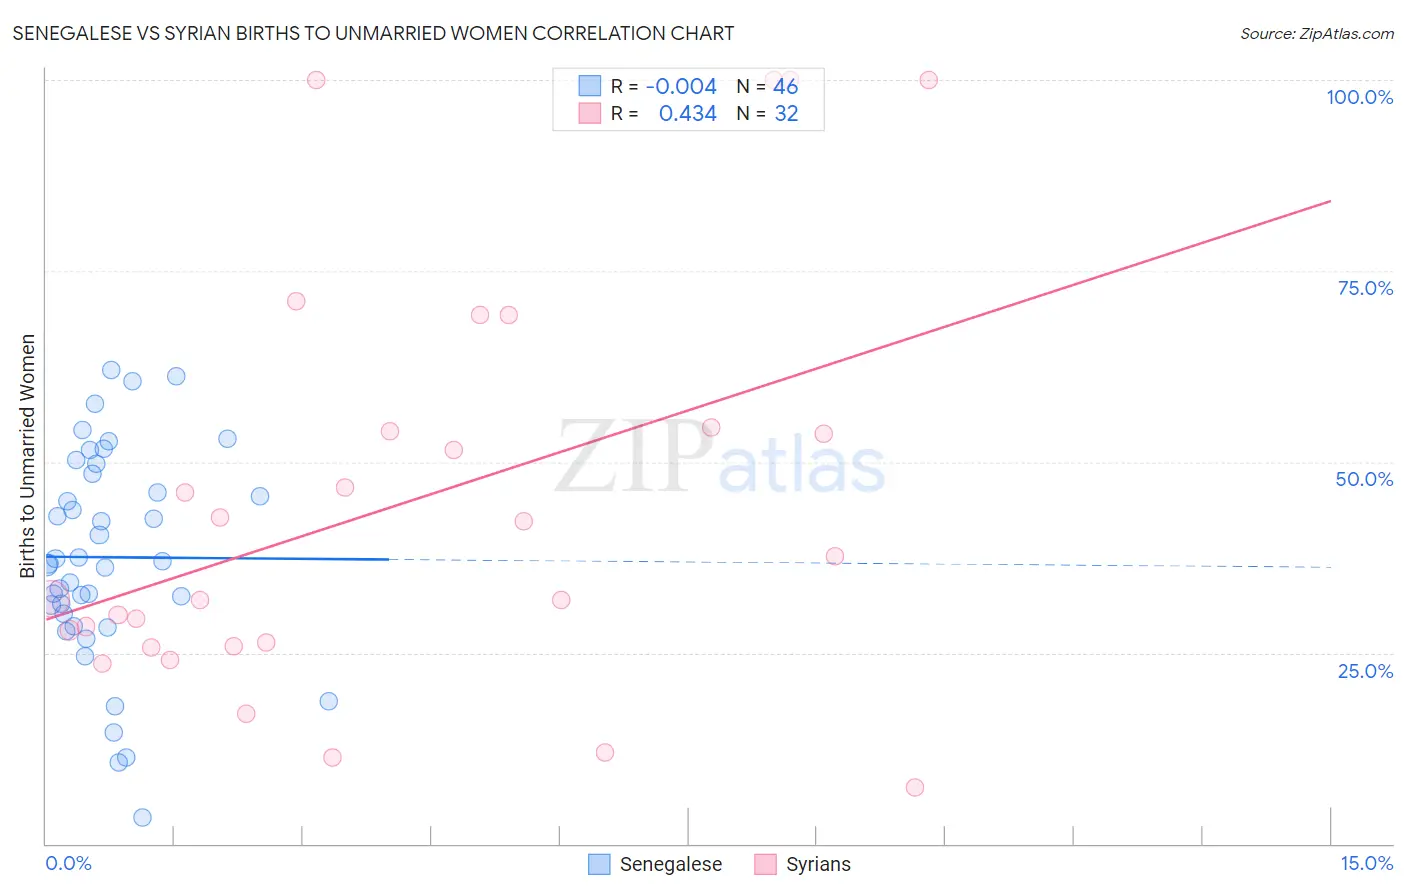
Senegalese vs Syrian Births to Unmarried Women Correlation Chart
The statistical analysis conducted on geographies consisting of 77,154,598 people shows no correlation between the proportion of Senegalese and percentage of births to unmarried women in the United States with a correlation coefficient (R) of -0.004 and weighted average of 36.8%. Similarly, the statistical analysis conducted on geographies consisting of 250,644,243 people shows a moderate positive correlation between the proportion of Syrians and percentage of births to unmarried women in the United States with a correlation coefficient (R) of 0.434 and weighted average of 30.2%, a difference of 21.9%.
Births to Unmarried Women Correlation Summary
| Measurement | Senegalese | Syrian |
| Minimum | 3.4% | 7.3% |
| Maximum | 62.0% | 100.0% |
| Range | 58.6% | 92.7% |
| Mean | 37.5% | 44.5% |
| Median | 36.8% | 34.9% |
| Interquartile 25% (IQ1) | 30.1% | 26.1% |
| Interquartile 75% (IQ3) | 48.4% | 54.3% |
| Interquartile Range (IQR) | 18.3% | 28.2% |
| Standard Deviation (Sample) | 13.8% | 26.8% |
| Standard Deviation (Population) | 13.7% | 26.4% |
Similar Demographics by Births to Unmarried Women
Demographics Similar to Senegalese by Births to Unmarried Women
In terms of births to unmarried women, the demographic groups most similar to Senegalese are Immigrants from Congo (36.8%, a difference of 0.080%), Immigrants from Barbados (36.8%, a difference of 0.10%), Comanche (36.7%, a difference of 0.12%), Central American (36.7%, a difference of 0.13%), and Immigrants from Senegal (36.7%, a difference of 0.20%).
| Demographics | Rating | Rank | Births to Unmarried Women |
| French American Indians | 0.1 /100 | #262 | Tragic 36.6% |
| Nicaraguans | 0.1 /100 | #263 | Tragic 36.6% |
| Sub-Saharan Africans | 0.1 /100 | #264 | Tragic 36.7% |
| Cherokee | 0.1 /100 | #265 | Tragic 36.7% |
| Immigrants | Senegal | 0.1 /100 | #266 | Tragic 36.7% |
| Central Americans | 0.1 /100 | #267 | Tragic 36.7% |
| Comanche | 0.1 /100 | #268 | Tragic 36.7% |
| Senegalese | 0.1 /100 | #269 | Tragic 36.8% |
| Immigrants | Congo | 0.1 /100 | #270 | Tragic 36.8% |
| Immigrants | Barbados | 0.1 /100 | #271 | Tragic 36.8% |
| Choctaw | 0.1 /100 | #272 | Tragic 36.9% |
| Mexicans | 0.1 /100 | #273 | Tragic 36.9% |
| Cree | 0.1 /100 | #274 | Tragic 37.0% |
| Barbadians | 0.1 /100 | #275 | Tragic 37.0% |
| Belizeans | 0.1 /100 | #276 | Tragic 37.0% |
Demographics Similar to Syrians by Births to Unmarried Women
In terms of births to unmarried women, the demographic groups most similar to Syrians are Croatian (30.2%, a difference of 0.040%), Vietnamese (30.2%, a difference of 0.11%), Immigrants from Argentina (30.1%, a difference of 0.13%), Korean (30.1%, a difference of 0.18%), and European (30.2%, a difference of 0.23%).
| Demographics | Rating | Rank | Births to Unmarried Women |
| Immigrants | Italy | 91.7 /100 | #116 | Exceptional 29.9% |
| Immigrants | Netherlands | 91.1 /100 | #117 | Exceptional 29.9% |
| Immigrants | Norway | 91.0 /100 | #118 | Exceptional 29.9% |
| Argentineans | 90.5 /100 | #119 | Exceptional 30.0% |
| Ugandans | 89.2 /100 | #120 | Excellent 30.1% |
| Koreans | 88.9 /100 | #121 | Excellent 30.1% |
| Immigrants | Argentina | 88.7 /100 | #122 | Excellent 30.1% |
| Syrians | 88.2 /100 | #123 | Excellent 30.2% |
| Croatians | 88.0 /100 | #124 | Excellent 30.2% |
| Vietnamese | 87.7 /100 | #125 | Excellent 30.2% |
| Europeans | 87.2 /100 | #126 | Excellent 30.2% |
| Chinese | 87.1 /100 | #127 | Excellent 30.2% |
| Icelanders | 86.0 /100 | #128 | Excellent 30.3% |
| Immigrants | Spain | 85.8 /100 | #129 | Excellent 30.3% |
| Immigrants | Bosnia and Herzegovina | 85.7 /100 | #130 | Excellent 30.3% |