Senegalese vs Immigrants from Sudan Male Poverty
COMPARE
Senegalese
Immigrants from Sudan
Male Poverty
Male Poverty Comparison
Senegalese
Immigrants from Sudan
14.1%
MALE POVERTY
0.0/ 100
METRIC RATING
304th/ 347
METRIC RANK
12.9%
MALE POVERTY
0.2/ 100
METRIC RATING
248th/ 347
METRIC RANK
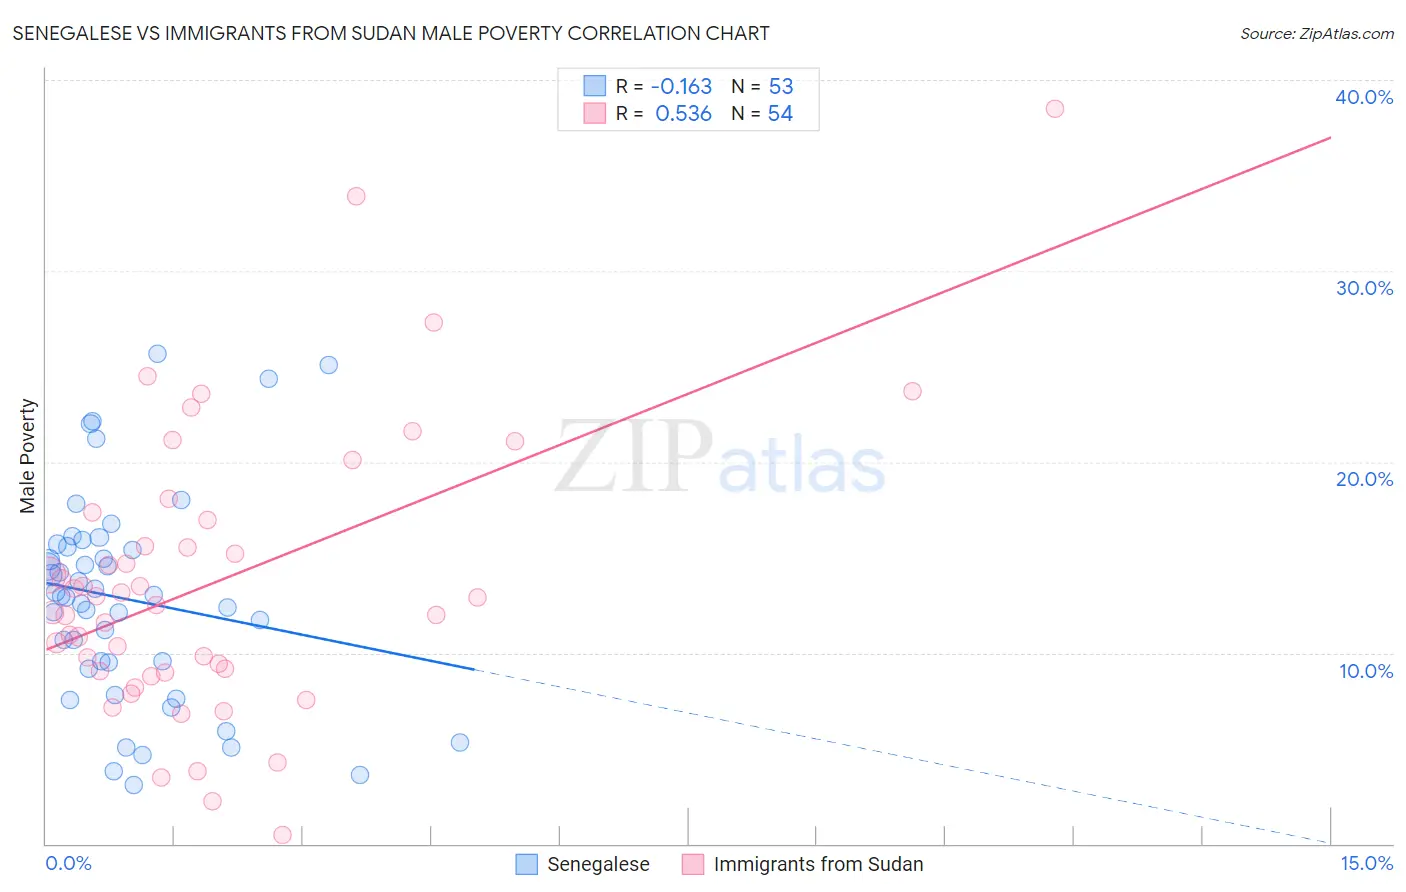
Senegalese vs Immigrants from Sudan Male Poverty Correlation Chart
The statistical analysis conducted on geographies consisting of 78,114,751 people shows a poor negative correlation between the proportion of Senegalese and poverty level among males in the United States with a correlation coefficient (R) of -0.163 and weighted average of 14.1%. Similarly, the statistical analysis conducted on geographies consisting of 118,946,491 people shows a substantial positive correlation between the proportion of Immigrants from Sudan and poverty level among males in the United States with a correlation coefficient (R) of 0.536 and weighted average of 12.9%, a difference of 9.1%.
Male Poverty Correlation Summary
| Measurement | Senegalese | Immigrants from Sudan |
| Minimum | 3.1% | 0.44% |
| Maximum | 25.7% | 38.5% |
| Range | 22.6% | 38.1% |
| Mean | 12.8% | 13.7% |
| Median | 13.0% | 12.7% |
| Interquartile 25% (IQ1) | 9.3% | 9.0% |
| Interquartile 75% (IQ3) | 15.6% | 16.9% |
| Interquartile Range (IQR) | 6.3% | 7.9% |
| Standard Deviation (Sample) | 5.5% | 7.4% |
| Standard Deviation (Population) | 5.4% | 7.3% |
Similar Demographics by Male Poverty
Demographics Similar to Senegalese by Male Poverty
In terms of male poverty, the demographic groups most similar to Senegalese are Bahamian (14.1%, a difference of 0.10%), Immigrants from Caribbean (14.0%, a difference of 0.14%), Immigrants from Senegal (14.0%, a difference of 0.20%), Immigrants from Bangladesh (14.1%, a difference of 0.21%), and Immigrants from Mexico (14.0%, a difference of 0.27%).
| Demographics | Rating | Rank | Male Poverty |
| Inupiat | 0.0 /100 | #297 | Tragic 14.0% |
| Blackfeet | 0.0 /100 | #298 | Tragic 14.0% |
| Immigrants | Guatemala | 0.0 /100 | #299 | Tragic 14.0% |
| Immigrants | Mexico | 0.0 /100 | #300 | Tragic 14.0% |
| Immigrants | Senegal | 0.0 /100 | #301 | Tragic 14.0% |
| Immigrants | Caribbean | 0.0 /100 | #302 | Tragic 14.0% |
| Bahamians | 0.0 /100 | #303 | Tragic 14.1% |
| Senegalese | 0.0 /100 | #304 | Tragic 14.1% |
| Immigrants | Bangladesh | 0.0 /100 | #305 | Tragic 14.1% |
| Creek | 0.0 /100 | #306 | Tragic 14.1% |
| Dutch West Indians | 0.0 /100 | #307 | Tragic 14.2% |
| Africans | 0.0 /100 | #308 | Tragic 14.2% |
| Somalis | 0.0 /100 | #309 | Tragic 14.3% |
| Seminole | 0.0 /100 | #310 | Tragic 14.3% |
| Hondurans | 0.0 /100 | #311 | Tragic 14.3% |
Demographics Similar to Immigrants from Sudan by Male Poverty
In terms of male poverty, the demographic groups most similar to Immigrants from Sudan are Immigrants from Western Africa (12.9%, a difference of 0.060%), Potawatomi (12.9%, a difference of 0.070%), Immigrants from Nicaragua (12.9%, a difference of 0.080%), Immigrants from Cuba (12.9%, a difference of 0.18%), and Immigrants from Ecuador (12.9%, a difference of 0.21%).
| Demographics | Rating | Rank | Male Poverty |
| Sudanese | 0.3 /100 | #241 | Tragic 12.8% |
| Nepalese | 0.3 /100 | #242 | Tragic 12.8% |
| Alaskan Athabascans | 0.3 /100 | #243 | Tragic 12.8% |
| Tsimshian | 0.3 /100 | #244 | Tragic 12.8% |
| Liberians | 0.3 /100 | #245 | Tragic 12.8% |
| Immigrants | El Salvador | 0.2 /100 | #246 | Tragic 12.8% |
| Immigrants | Western Africa | 0.2 /100 | #247 | Tragic 12.9% |
| Immigrants | Sudan | 0.2 /100 | #248 | Tragic 12.9% |
| Potawatomi | 0.2 /100 | #249 | Tragic 12.9% |
| Immigrants | Nicaragua | 0.2 /100 | #250 | Tragic 12.9% |
| Immigrants | Cuba | 0.2 /100 | #251 | Tragic 12.9% |
| Immigrants | Ecuador | 0.2 /100 | #252 | Tragic 12.9% |
| Immigrants | Ghana | 0.2 /100 | #253 | Tragic 12.9% |
| Mexican American Indians | 0.1 /100 | #254 | Tragic 13.0% |
| Immigrants | Liberia | 0.1 /100 | #255 | Tragic 13.0% |