Senegalese vs Soviet Union Male Poverty
COMPARE
Senegalese
Soviet Union
Male Poverty
Male Poverty Comparison
Senegalese
Soviet Union
14.1%
MALE POVERTY
0.0/ 100
METRIC RATING
304th/ 347
METRIC RANK
11.1%
MALE POVERTY
60.3/ 100
METRIC RATING
160th/ 347
METRIC RANK
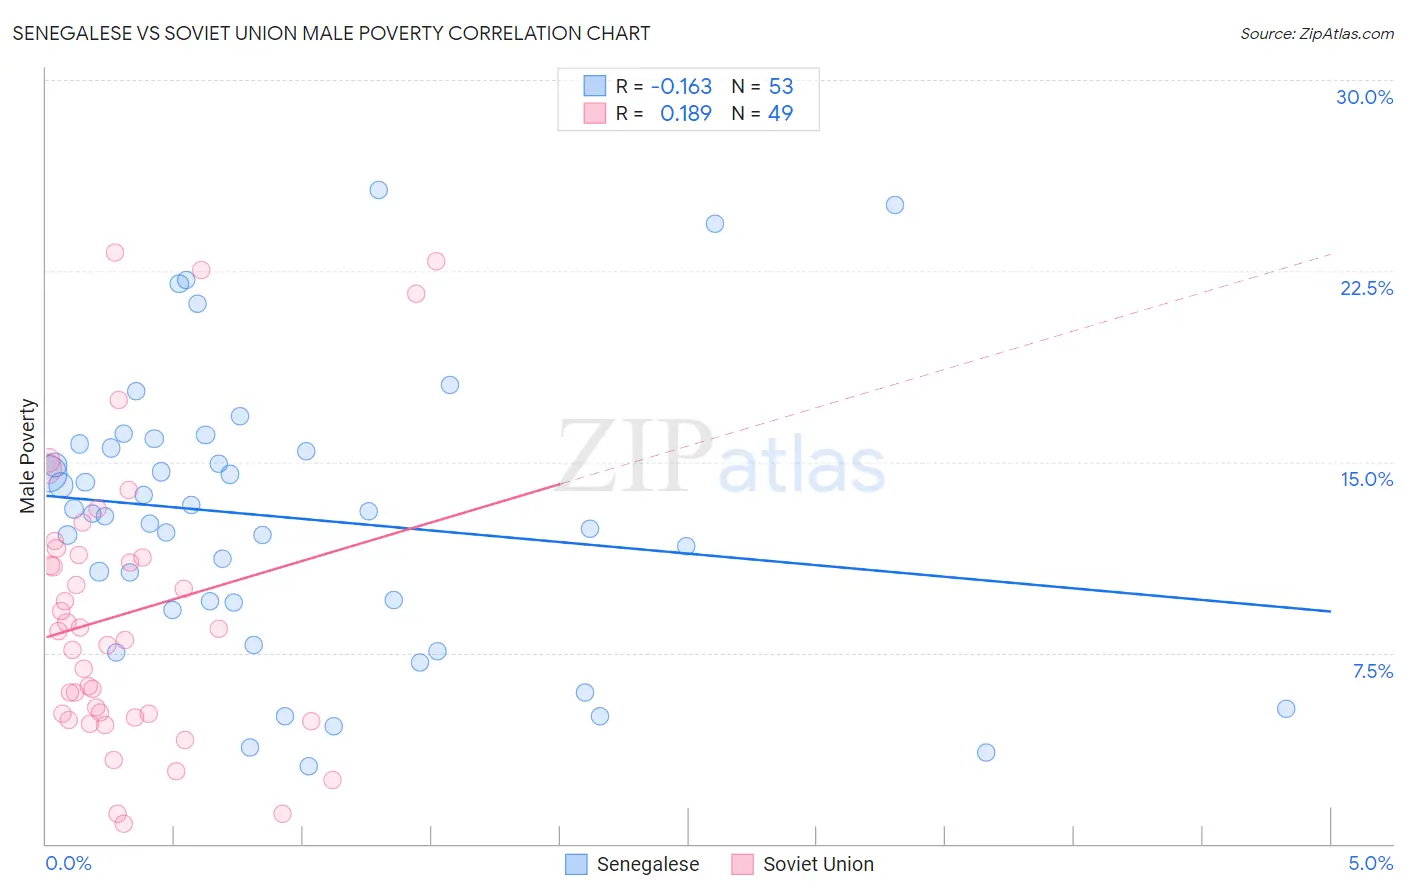
Senegalese vs Soviet Union Male Poverty Correlation Chart
The statistical analysis conducted on geographies consisting of 78,114,751 people shows a poor negative correlation between the proportion of Senegalese and poverty level among males in the United States with a correlation coefficient (R) of -0.163 and weighted average of 14.1%. Similarly, the statistical analysis conducted on geographies consisting of 43,503,005 people shows a poor positive correlation between the proportion of Soviet Union and poverty level among males in the United States with a correlation coefficient (R) of 0.189 and weighted average of 11.1%, a difference of 27.1%.
Male Poverty Correlation Summary
| Measurement | Senegalese | Soviet Union |
| Minimum | 3.1% | 0.80% |
| Maximum | 25.7% | 23.2% |
| Range | 22.6% | 22.4% |
| Mean | 12.8% | 9.1% |
| Median | 13.0% | 8.4% |
| Interquartile 25% (IQ1) | 9.3% | 5.0% |
| Interquartile 75% (IQ3) | 15.6% | 11.5% |
| Interquartile Range (IQR) | 6.3% | 6.4% |
| Standard Deviation (Sample) | 5.5% | 5.6% |
| Standard Deviation (Population) | 5.4% | 5.5% |
Similar Demographics by Male Poverty
Demographics Similar to Senegalese by Male Poverty
In terms of male poverty, the demographic groups most similar to Senegalese are Bahamian (14.1%, a difference of 0.10%), Immigrants from Caribbean (14.0%, a difference of 0.14%), Immigrants from Senegal (14.0%, a difference of 0.20%), Immigrants from Bangladesh (14.1%, a difference of 0.21%), and Immigrants from Mexico (14.0%, a difference of 0.27%).
| Demographics | Rating | Rank | Male Poverty |
| Inupiat | 0.0 /100 | #297 | Tragic 14.0% |
| Blackfeet | 0.0 /100 | #298 | Tragic 14.0% |
| Immigrants | Guatemala | 0.0 /100 | #299 | Tragic 14.0% |
| Immigrants | Mexico | 0.0 /100 | #300 | Tragic 14.0% |
| Immigrants | Senegal | 0.0 /100 | #301 | Tragic 14.0% |
| Immigrants | Caribbean | 0.0 /100 | #302 | Tragic 14.0% |
| Bahamians | 0.0 /100 | #303 | Tragic 14.1% |
| Senegalese | 0.0 /100 | #304 | Tragic 14.1% |
| Immigrants | Bangladesh | 0.0 /100 | #305 | Tragic 14.1% |
| Creek | 0.0 /100 | #306 | Tragic 14.1% |
| Dutch West Indians | 0.0 /100 | #307 | Tragic 14.2% |
| Africans | 0.0 /100 | #308 | Tragic 14.2% |
| Somalis | 0.0 /100 | #309 | Tragic 14.3% |
| Seminole | 0.0 /100 | #310 | Tragic 14.3% |
| Hondurans | 0.0 /100 | #311 | Tragic 14.3% |
Demographics Similar to Soviet Union by Male Poverty
In terms of male poverty, the demographic groups most similar to Soviet Union are Immigrants from Northern Africa (11.1%, a difference of 0.070%), Taiwanese (11.0%, a difference of 0.25%), Colombian (11.0%, a difference of 0.28%), Immigrants from Chile (11.1%, a difference of 0.30%), and Scotch-Irish (11.0%, a difference of 0.35%).
| Demographics | Rating | Rank | Male Poverty |
| Immigrants | Bosnia and Herzegovina | 65.2 /100 | #153 | Good 11.0% |
| Immigrants | Kazakhstan | 64.8 /100 | #154 | Good 11.0% |
| Immigrants | Malaysia | 64.7 /100 | #155 | Good 11.0% |
| Costa Ricans | 63.9 /100 | #156 | Good 11.0% |
| Scotch-Irish | 63.7 /100 | #157 | Good 11.0% |
| Colombians | 63.0 /100 | #158 | Good 11.0% |
| Taiwanese | 62.7 /100 | #159 | Good 11.0% |
| Soviet Union | 60.3 /100 | #160 | Good 11.1% |
| Immigrants | Northern Africa | 59.7 /100 | #161 | Average 11.1% |
| Immigrants | Chile | 57.4 /100 | #162 | Average 11.1% |
| Whites/Caucasians | 56.7 /100 | #163 | Average 11.1% |
| Ethiopians | 56.7 /100 | #164 | Average 11.1% |
| Immigrants | Spain | 55.5 /100 | #165 | Average 11.1% |
| Immigrants | Albania | 55.3 /100 | #166 | Average 11.1% |
| Hungarians | 55.1 /100 | #167 | Average 11.1% |