French vs Syrian Male Poverty

COMPARE

French
Race
Ancestry
AfghanAfricanAlaska NativeAlaskan AthabascanAlbanianAleutAlsatianAmericanApacheArabArapahoArgentineanArmenianAssyrian/Chaldean/SyriacAustralianAustrianBahamianBangladeshiBarbadianBasqueBelgianBelizeanBermudanBhutaneseBlackfeetBolivianBrazilianBritishBritish West IndianBulgarianBurmeseCajunCambodianCanadianCape VerdeanCarpatho RusynCelticCentral AmericanCentral American IndianCherokeeCheyenneChickasawChileanChineseChippewaChoctawColombianColvilleComancheCosta RicanCreeCreekCroatianCrowCubanCypriotCzechCzechoslovakianDanishDelawareDominicanDutchDutch West IndianEastern EuropeanEcuadorianEgyptianEnglishEstonianEthiopianEuropeanFijianFilipinoFinnishFrenchFrench American IndianFrench CanadianGermanGerman RussianGhanaianGreekGuamanian/ChamorroGuatemalanGuyaneseHaitianHmongHonduranHopiHoumaHungarianIcelanderIndian (Asian)IndonesianInupiatIranianIraqiIrishIroquoisIsraeliItalianJamaicanJapaneseJordanianKenyanKiowaKoreanLaotianLatvianLebaneseLiberianLithuanianLumbeeLuxembourgerMacedonianMalaysianMalteseMarshalleseMenomineeMexicanMexican American IndianMongolianMoroccanNative HawaiianNavajoNepaleseNew ZealanderNicaraguanNigerianNorthern EuropeanNorwegianOkinawanOsageOttawaPaiutePakistaniPalestinianPanamanianParaguayanPennsylvania GermanPeruvianPimaPolishPortuguesePotawatomiPuebloPuerto RicanPuget Sound SalishRomanianRussianSalvadoranSamoanScandinavianScotch-IrishScottishSeminoleSenegaleseSerbianShoshoneSierra LeoneanSiouxSlavicSlovakSloveneSomaliSouth AfricanSouth AmericanSouth American IndianSoviet UnionSpaniardSpanishSpanish AmericanSpanish American IndianSri LankanSubsaharan AfricanSudaneseSwedishSwissTaiwaneseThaiTlingit-HaidaTohono O'OdhamTonganTrinidadian and TobagonianTsimshianTurkishU.S. Virgin IslanderUgandanUkrainianUruguayanUteVenezuelanVietnameseWelshWest IndianYakamaYaquiYugoslavianYumanYup'ikZimbabwean
Immigration
NonimmigrantsImmigrantsAfghanistanAfricaAlbaniaArgentinaArmeniaAsiaAustraliaAustriaBahamasBangladeshBarbadosBelarusBelgiumBelizeBoliviaBosnia and HerzegovinaBrazilBulgariaBurma/MyanmarCabo VerdeCambodiaCameroonCanadaCaribbeanCentral AmericaChileChinaColombiaCongoCosta RicaCroatiaCubaCzechoslovakiaDenmarkDominicaDominican RepublicEastern AfricaEastern AsiaEastern EuropeEcuadorEgyptEl SalvadorEnglandEritreaEthiopiaEuropeFijiFranceGermanyGhanaGreeceGrenadaGuatemalaGuyanaHaitiHondurasHong KongHungaryIndiaIndonesiaIranIraqIrelandIsraelItalyJamaicaJapanJordanKazakhstanKenyaKoreaKuwaitLaosLatin AmericaLatviaLebanonLiberiaLithuaniaMalaysiaMexicoMicronesiaMiddle AfricaMoldovaMoroccoNepalNetherlandsNicaraguaNigeriaNorth AmericaNorth MacedoniaNorthern AfricaNorthern EuropeNorwayOceaniaPakistanPanamaPeruPhilippinesPolandPortugalRomaniaRussiaSaudi ArabiaScotlandSenegalSerbiaSierra LeoneSingaporeSomaliaSouth AfricaSouth AmericaSouth Central AsiaSouth Eastern AsiaSouthern EuropeSpainSri LankaSt. Vincent and the GrenadinesSudanSwedenSwitzerlandSyriaTaiwanThailandTrinidad and TobagoTurkeyUgandaUkraineUruguayUzbekistanVenezuelaVietnamWest IndiesWestern AfricaWestern AsiaWestern EuropeYemenZaireZimbabweAzores
Syrian
Race
Ancestry
AfghanAfricanAlaska NativeAlaskan AthabascanAlbanianAleutAlsatianAmericanApacheArabArapahoArgentineanArmenianAssyrian/Chaldean/SyriacAustralianAustrianBahamianBangladeshiBarbadianBasqueBelgianBelizeanBermudanBhutaneseBlackfeetBolivianBrazilianBritishBritish West IndianBulgarianBurmeseCajunCambodianCanadianCape VerdeanCarpatho RusynCelticCentral AmericanCentral American IndianCherokeeCheyenneChickasawChileanChineseChippewaChoctawColombianColvilleComancheCosta RicanCreeCreekCroatianCrowCubanCypriotCzechCzechoslovakianDanishDelawareDominicanDutchDutch West IndianEastern EuropeanEcuadorianEgyptianEnglishEstonianEthiopianEuropeanFijianFilipinoFinnishFrench American IndianFrench CanadianGermanGerman RussianGhanaianGreekGuamanian/ChamorroGuatemalanGuyaneseHaitianHmongHonduranHopiHoumaHungarianIcelanderIndian (Asian)IndonesianInupiatIranianIraqiIrishIroquoisIsraeliItalianJamaicanJapaneseJordanianKenyanKiowaKoreanLaotianLatvianLebaneseLiberianLithuanianLumbeeLuxembourgerMacedonianMalaysianMalteseMarshalleseMenomineeMexicanMexican American IndianMongolianMoroccanNative HawaiianNavajoNepaleseNew ZealanderNicaraguanNigerianNorthern EuropeanNorwegianOkinawanOsageOttawaPaiutePakistaniPalestinianPanamanianParaguayanPennsylvania GermanPeruvianPimaPolishPortuguesePotawatomiPuebloPuerto RicanPuget Sound SalishRomanianRussianSalvadoranSamoanScandinavianScotch-IrishScottishSeminoleSenegaleseSerbianShoshoneSierra LeoneanSiouxSlavicSlovakSloveneSomaliSouth AfricanSouth AmericanSouth American IndianSoviet UnionSpaniardSpanishSpanish AmericanSpanish American IndianSri LankanSubsaharan AfricanSudaneseSwedishSwissSyrianTaiwaneseThaiTlingit-HaidaTohono O'OdhamTonganTrinidadian and TobagonianTsimshianTurkishU.S. Virgin IslanderUgandanUkrainianUruguayanUteVenezuelanVietnameseWelshWest IndianYakamaYaquiYugoslavianYumanYup'ikZimbabwean
Immigration
NonimmigrantsImmigrantsAfghanistanAfricaAlbaniaArgentinaArmeniaAsiaAustraliaAustriaBahamasBangladeshBarbadosBelarusBelgiumBelizeBoliviaBosnia and HerzegovinaBrazilBulgariaBurma/MyanmarCabo VerdeCambodiaCameroonCanadaCaribbeanCentral AmericaChileChinaColombiaCongoCosta RicaCroatiaCubaCzechoslovakiaDenmarkDominicaDominican RepublicEastern AfricaEastern AsiaEastern EuropeEcuadorEgyptEl SalvadorEnglandEritreaEthiopiaEuropeFijiFranceGermanyGhanaGreeceGrenadaGuatemalaGuyanaHaitiHondurasHong KongHungaryIndiaIndonesiaIranIraqIrelandIsraelItalyJamaicaJapanJordanKazakhstanKenyaKoreaKuwaitLaosLatin AmericaLatviaLebanonLiberiaLithuaniaMalaysiaMexicoMicronesiaMiddle AfricaMoldovaMoroccoNepalNetherlandsNicaraguaNigeriaNorth AmericaNorth MacedoniaNorthern AfricaNorthern EuropeNorwayOceaniaPakistanPanamaPeruPhilippinesPolandPortugalRomaniaRussiaSaudi ArabiaScotlandSenegalSerbiaSierra LeoneSingaporeSomaliaSouth AfricaSouth AmericaSouth Central AsiaSouth Eastern AsiaSouthern EuropeSpainSri LankaSt. Vincent and the GrenadinesSudanSwedenSwitzerlandSyriaTaiwanThailandTrinidad and TobagoTurkeyUgandaUkraineUruguayUzbekistanVenezuelaVietnamWest IndiesWestern AfricaWestern AsiaWestern EuropeYemenZaireZimbabweAzores
Male Poverty
Income
Poverty
Unemployment
Labor Participation
Family Structure
Vehicle Availability
Education Level
Disability

Male Poverty Comparison

French

Syrians

Excellent
Good
10.7%
MALE POVERTY
86.7/ 100
METRIC RATING
124th/ 347
METRIC RANK
10.9%
MALE POVERTY
71.4/ 100
METRIC RATING
146th/ 347
METRIC RANK

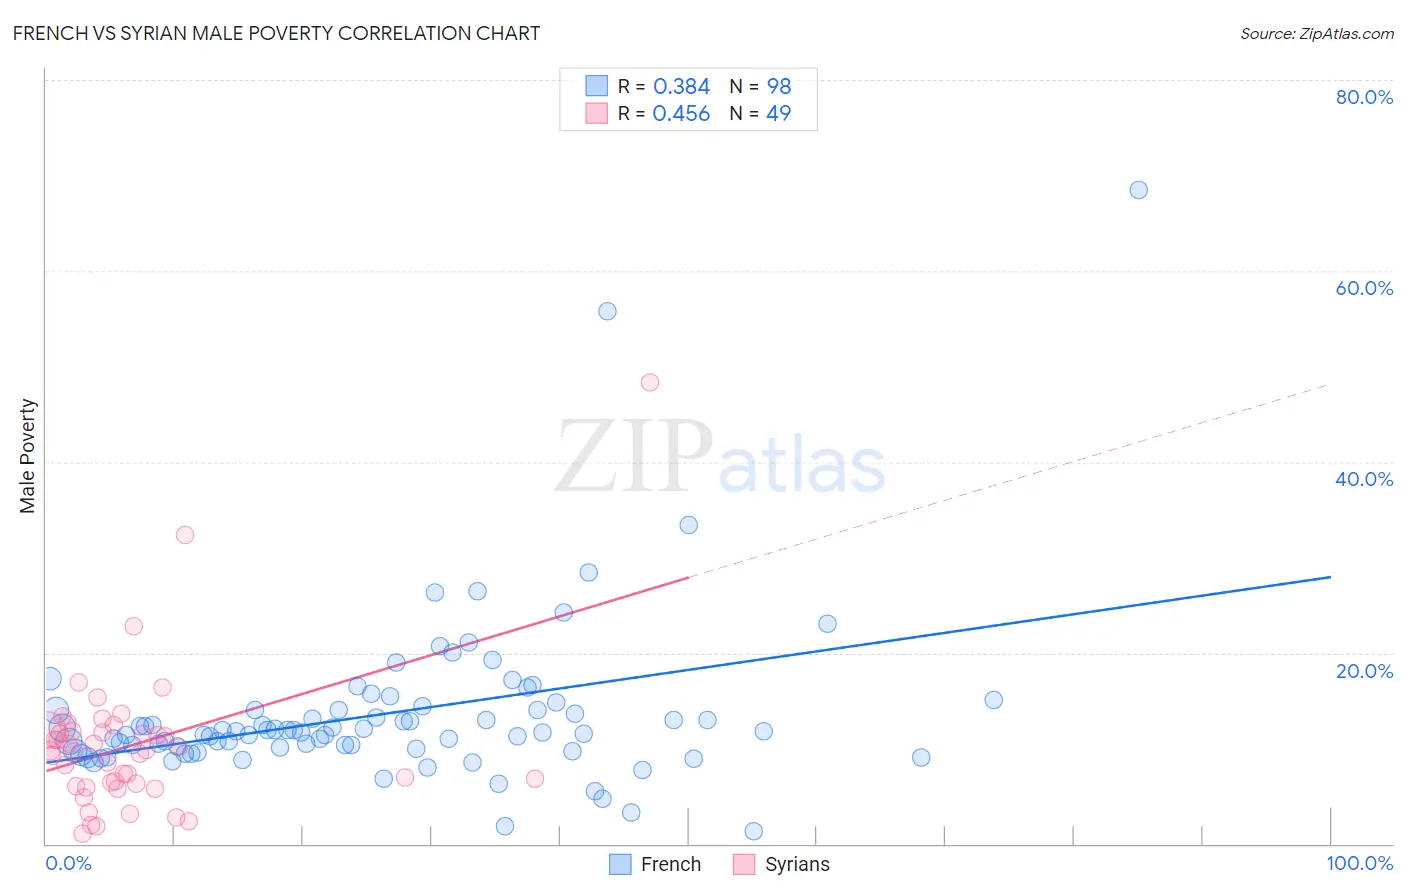
French vs Syrian Male Poverty Correlation Chart

The statistical analysis conducted on geographies consisting of 570,714,674 people shows a mild positive correlation between the proportion of French and poverty level among males in the United States with a correlation coefficient (R) of 0.384 and weighted average of 10.7%. Similarly, the statistical analysis conducted on geographies consisting of 266,155,974 people shows a moderate positive correlation between the proportion of Syrians and poverty level among males in the United States with a correlation coefficient (R) of 0.456 and weighted average of 10.9%, a difference of 2.5%.
French vs Syrian Male Poverty

Male Poverty Correlation Summary

MeasurementFrenchSyrian
Minimum1.3%1.0%
Maximum68.4%48.3%
Range67.2%47.3%
Mean13.6%10.4%
Median11.7%9.7%
Interquartile 25% (IQ1)9.9%6.2%
Interquartile 75% (IQ3)14.0%11.8%
Interquartile Range (IQR)4.1%5.7%
Standard Deviation (Sample)8.8%7.8%
Standard Deviation (Population)8.7%7.7%

Similar Demographics by Male Poverty

Demographics Similar to French by Male Poverty

In terms of male poverty, the demographic groups most similar to French are South African (10.7%, a difference of 0.030%), Native Hawaiian (10.7%, a difference of 0.070%), Peruvian (10.7%, a difference of 0.080%), Immigrants from China (10.7%, a difference of 0.10%), and Immigrants from Norway (10.7%, a difference of 0.15%).
DemographicsRating | RankMale Poverty
Immigrants | South Eastern Asia
88.1
/100
|
#117
Excellent
10.6%
Okinawans
87.6
/100
|
#118
Excellent
10.7%
Immigrants | Hungary
87.6
/100
|
#119
Excellent
10.7%
Immigrants | China
87.1
/100
|
#120
Excellent
10.7%
Peruvians
87.1
/100
|
#121
Excellent
10.7%
Native Hawaiians
87.0
/100
|
#122
Excellent
10.7%
South Africans
86.8
/100
|
#123
Excellent
10.7%
French
86.7
/100
|
#124
Excellent
10.7%
Immigrants | Norway
86.0
/100
|
#125
Excellent
10.7%
Immigrants | Ukraine
84.3
/100
|
#126
Excellent
10.7%
Puget Sound Salish
84.3
/100
|
#127
Excellent
10.7%
Immigrants | Western Europe
84.2
/100
|
#128
Excellent
10.7%
Immigrants | Peru
84.1
/100
|
#129
Excellent
10.7%
Chileans
83.9
/100
|
#130
Excellent
10.7%
Immigrants | Belarus
83.3
/100
|
#131
Excellent
10.7%

Demographics Similar to Syrians by Male Poverty

In terms of male poverty, the demographic groups most similar to Syrians are Immigrants from Germany (10.9%, a difference of 0.030%), Samoan (10.9%, a difference of 0.050%), Afghan (10.9%, a difference of 0.070%), Icelander (11.0%, a difference of 0.34%), and Armenian (11.0%, a difference of 0.40%).
DemographicsRating | RankMale Poverty
Immigrants | Jordan
77.5
/100
|
#139
Good
10.8%
Tlingit-Haida
76.1
/100
|
#140
Good
10.9%
Immigrants | France
75.8
/100
|
#141
Good
10.9%
Basques
74.6
/100
|
#142
Good
10.9%
Afghans
71.9
/100
|
#143
Good
10.9%
Samoans
71.8
/100
|
#144
Good
10.9%
Immigrants | Germany
71.6
/100
|
#145
Good
10.9%
Syrians
71.4
/100
|
#146
Good
10.9%
Icelanders
68.5
/100
|
#147
Good
11.0%
Armenians
68.0
/100
|
#148
Good
11.0%
Immigrants | Venezuela
67.9
/100
|
#149
Good
11.0%
Guamanians/Chamorros
67.6
/100
|
#150
Good
11.0%
Venezuelans
67.4
/100
|
#151
Good
11.0%
Immigrants | Nepal
67.3
/100
|
#152
Good
11.0%
Immigrants | Bosnia and Herzegovina
65.2
/100
|
#153
Good
11.0%