Senegalese vs Immigrants from St. Vincent and the Grenadines Male Poverty
COMPARE
Senegalese
Immigrants from St. Vincent and the Grenadines
Male Poverty
Male Poverty Comparison
Senegalese
Immigrants from St. Vincent and the Grenadines
14.1%
MALE POVERTY
0.0/ 100
METRIC RATING
304th/ 347
METRIC RANK
13.8%
MALE POVERTY
0.0/ 100
METRIC RATING
288th/ 347
METRIC RANK
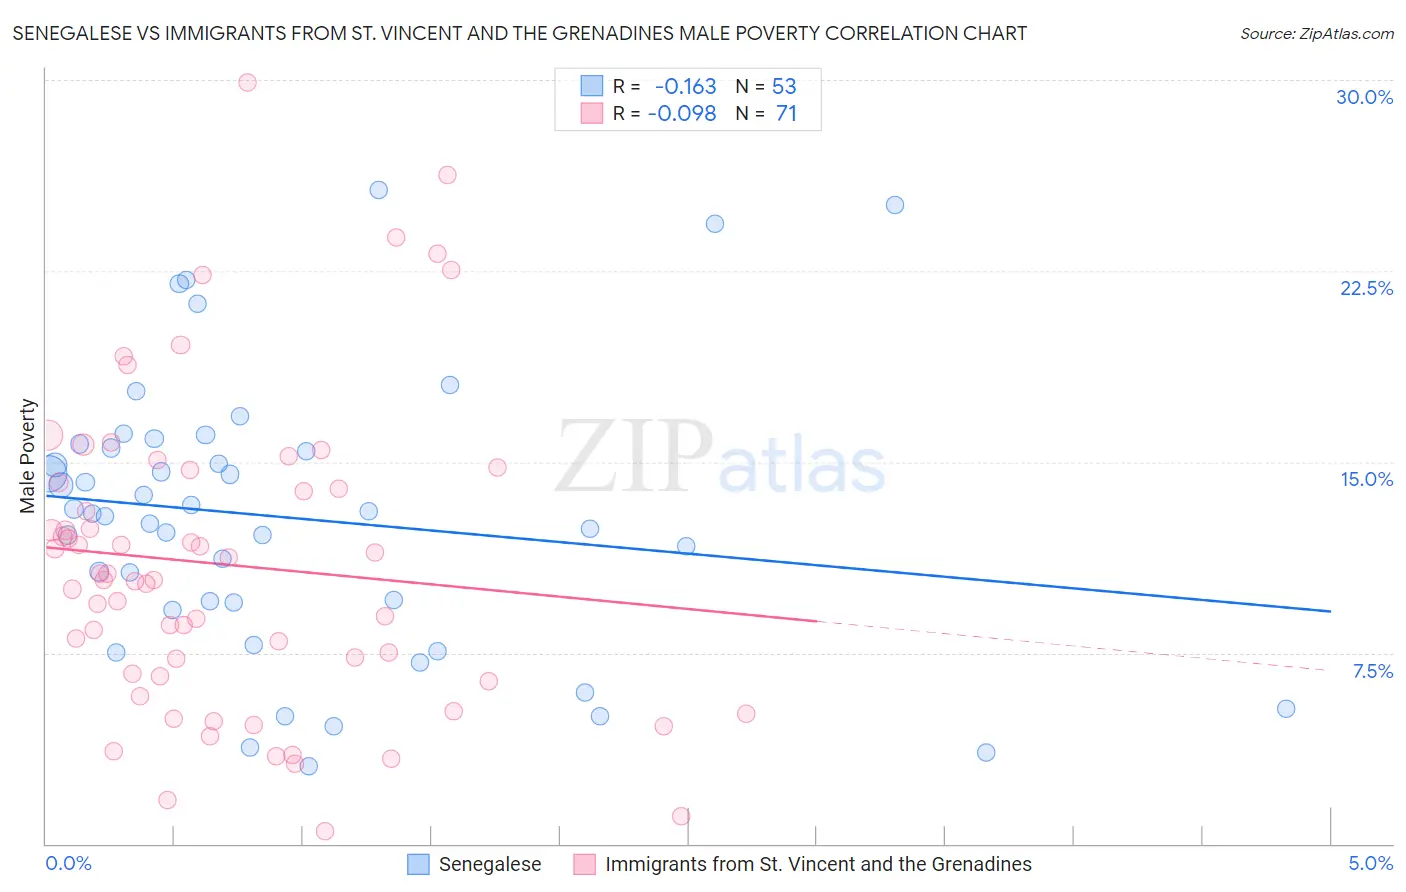
Senegalese vs Immigrants from St. Vincent and the Grenadines Male Poverty Correlation Chart
The statistical analysis conducted on geographies consisting of 78,114,751 people shows a poor negative correlation between the proportion of Senegalese and poverty level among males in the United States with a correlation coefficient (R) of -0.163 and weighted average of 14.1%. Similarly, the statistical analysis conducted on geographies consisting of 56,096,349 people shows a slight negative correlation between the proportion of Immigrants from St. Vincent and the Grenadines and poverty level among males in the United States with a correlation coefficient (R) of -0.098 and weighted average of 13.8%, a difference of 2.1%.
Male Poverty Correlation Summary
| Measurement | Senegalese | Immigrants from St. Vincent and the Grenadines |
| Minimum | 3.1% | 0.49% |
| Maximum | 25.7% | 29.9% |
| Range | 22.6% | 29.4% |
| Mean | 12.8% | 11.0% |
| Median | 13.0% | 10.4% |
| Interquartile 25% (IQ1) | 9.3% | 6.6% |
| Interquartile 75% (IQ3) | 15.6% | 14.2% |
| Interquartile Range (IQR) | 6.3% | 7.6% |
| Standard Deviation (Sample) | 5.5% | 6.1% |
| Standard Deviation (Population) | 5.4% | 6.0% |
Demographics Similar to Senegalese and Immigrants from St. Vincent and the Grenadines by Male Poverty
In terms of male poverty, the demographic groups most similar to Senegalese are Bahamian (14.1%, a difference of 0.10%), Immigrants from Caribbean (14.0%, a difference of 0.14%), Immigrants from Senegal (14.0%, a difference of 0.20%), Immigrants from Bangladesh (14.1%, a difference of 0.21%), and Immigrants from Mexico (14.0%, a difference of 0.27%). Similarly, the demographic groups most similar to Immigrants from St. Vincent and the Grenadines are Immigrants from Barbados (13.8%, a difference of 0.17%), Guatemalan (13.8%, a difference of 0.17%), Shoshone (13.8%, a difference of 0.18%), Immigrants from Zaire (13.8%, a difference of 0.18%), and Vietnamese (13.8%, a difference of 0.27%).
| Demographics | Rating | Rank | Male Poverty |
| Shoshone | 0.0 /100 | #286 | Tragic 13.8% |
| Immigrants | Barbados | 0.0 /100 | #287 | Tragic 13.8% |
| Immigrants | St. Vincent and the Grenadines | 0.0 /100 | #288 | Tragic 13.8% |
| Guatemalans | 0.0 /100 | #289 | Tragic 13.8% |
| Immigrants | Zaire | 0.0 /100 | #290 | Tragic 13.8% |
| Vietnamese | 0.0 /100 | #291 | Tragic 13.8% |
| Indonesians | 0.0 /100 | #292 | Tragic 13.8% |
| Immigrants | Belize | 0.0 /100 | #293 | Tragic 13.8% |
| Hispanics or Latinos | 0.0 /100 | #294 | Tragic 13.9% |
| Immigrants | Central America | 0.0 /100 | #295 | Tragic 13.9% |
| Cajuns | 0.0 /100 | #296 | Tragic 13.9% |
| Inupiat | 0.0 /100 | #297 | Tragic 14.0% |
| Blackfeet | 0.0 /100 | #298 | Tragic 14.0% |
| Immigrants | Guatemala | 0.0 /100 | #299 | Tragic 14.0% |
| Immigrants | Mexico | 0.0 /100 | #300 | Tragic 14.0% |
| Immigrants | Senegal | 0.0 /100 | #301 | Tragic 14.0% |
| Immigrants | Caribbean | 0.0 /100 | #302 | Tragic 14.0% |
| Bahamians | 0.0 /100 | #303 | Tragic 14.1% |
| Senegalese | 0.0 /100 | #304 | Tragic 14.1% |
| Immigrants | Bangladesh | 0.0 /100 | #305 | Tragic 14.1% |
| Creek | 0.0 /100 | #306 | Tragic 14.1% |