Iranian vs Syrian Male Poverty
COMPARE
Iranian
Syrian
Male Poverty
Male Poverty Comparison
Iranians
Syrians
9.8%
MALE POVERTY
99.4/ 100
METRIC RATING
35th/ 347
METRIC RANK
10.9%
MALE POVERTY
71.4/ 100
METRIC RATING
146th/ 347
METRIC RANK
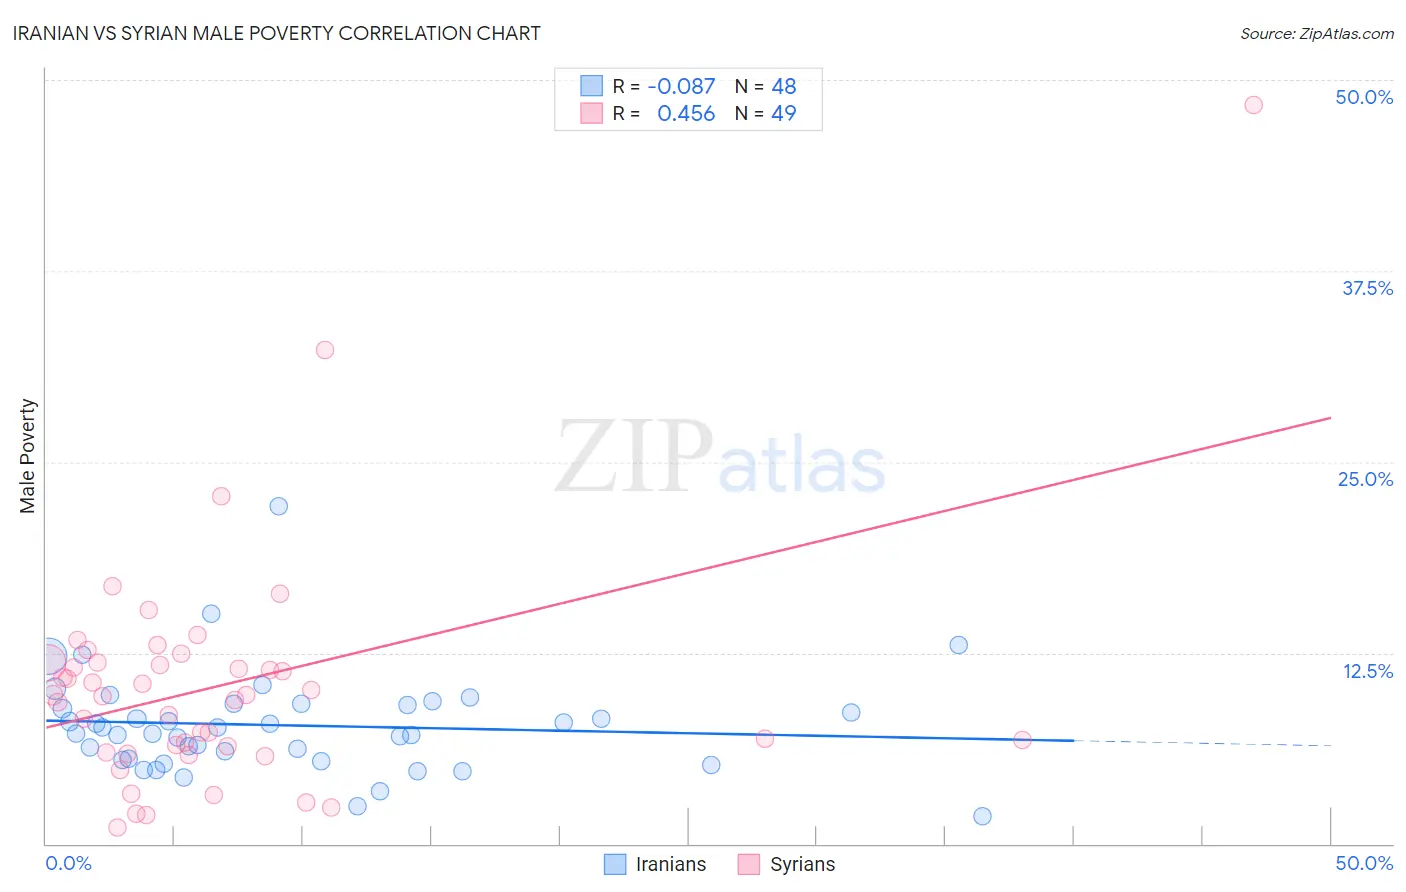
Iranian vs Syrian Male Poverty Correlation Chart
The statistical analysis conducted on geographies consisting of 316,583,039 people shows a slight negative correlation between the proportion of Iranians and poverty level among males in the United States with a correlation coefficient (R) of -0.087 and weighted average of 9.8%. Similarly, the statistical analysis conducted on geographies consisting of 266,155,974 people shows a moderate positive correlation between the proportion of Syrians and poverty level among males in the United States with a correlation coefficient (R) of 0.456 and weighted average of 10.9%, a difference of 11.7%.
Male Poverty Correlation Summary
| Measurement | Iranian | Syrian |
| Minimum | 1.8% | 1.0% |
| Maximum | 22.1% | 48.3% |
| Range | 20.3% | 47.3% |
| Mean | 7.8% | 10.4% |
| Median | 7.4% | 9.7% |
| Interquartile 25% (IQ1) | 5.5% | 6.2% |
| Interquartile 75% (IQ3) | 9.1% | 11.8% |
| Interquartile Range (IQR) | 3.6% | 5.7% |
| Standard Deviation (Sample) | 3.4% | 7.8% |
| Standard Deviation (Population) | 3.3% | 7.7% |
Similar Demographics by Male Poverty
Demographics Similar to Iranians by Male Poverty
In terms of male poverty, the demographic groups most similar to Iranians are Czech (9.8%, a difference of 0.090%), Immigrants from Poland (9.8%, a difference of 0.30%), Immigrants from Greece (9.8%, a difference of 0.31%), Immigrants from Northern Europe (9.7%, a difference of 0.45%), and Macedonian (9.7%, a difference of 0.54%).
| Demographics | Rating | Rank | Male Poverty |
| Immigrants | Korea | 99.6 /100 | #28 | Exceptional 9.7% |
| Greeks | 99.6 /100 | #29 | Exceptional 9.7% |
| Poles | 99.5 /100 | #30 | Exceptional 9.7% |
| Tongans | 99.5 /100 | #31 | Exceptional 9.7% |
| Macedonians | 99.5 /100 | #32 | Exceptional 9.7% |
| Immigrants | Northern Europe | 99.5 /100 | #33 | Exceptional 9.7% |
| Immigrants | Poland | 99.5 /100 | #34 | Exceptional 9.8% |
| Iranians | 99.4 /100 | #35 | Exceptional 9.8% |
| Czechs | 99.4 /100 | #36 | Exceptional 9.8% |
| Immigrants | Greece | 99.3 /100 | #37 | Exceptional 9.8% |
| Immigrants | Pakistan | 99.2 /100 | #38 | Exceptional 9.9% |
| Russians | 99.2 /100 | #39 | Exceptional 9.9% |
| Cypriots | 99.2 /100 | #40 | Exceptional 9.9% |
| Koreans | 99.2 /100 | #41 | Exceptional 9.9% |
| Immigrants | Iran | 99.1 /100 | #42 | Exceptional 9.9% |
Demographics Similar to Syrians by Male Poverty
In terms of male poverty, the demographic groups most similar to Syrians are Immigrants from Germany (10.9%, a difference of 0.030%), Samoan (10.9%, a difference of 0.050%), Afghan (10.9%, a difference of 0.070%), Icelander (11.0%, a difference of 0.34%), and Armenian (11.0%, a difference of 0.40%).
| Demographics | Rating | Rank | Male Poverty |
| Immigrants | Jordan | 77.5 /100 | #139 | Good 10.8% |
| Tlingit-Haida | 76.1 /100 | #140 | Good 10.9% |
| Immigrants | France | 75.8 /100 | #141 | Good 10.9% |
| Basques | 74.6 /100 | #142 | Good 10.9% |
| Afghans | 71.9 /100 | #143 | Good 10.9% |
| Samoans | 71.8 /100 | #144 | Good 10.9% |
| Immigrants | Germany | 71.6 /100 | #145 | Good 10.9% |
| Syrians | 71.4 /100 | #146 | Good 10.9% |
| Icelanders | 68.5 /100 | #147 | Good 11.0% |
| Armenians | 68.0 /100 | #148 | Good 11.0% |
| Immigrants | Venezuela | 67.9 /100 | #149 | Good 11.0% |
| Guamanians/Chamorros | 67.6 /100 | #150 | Good 11.0% |
| Venezuelans | 67.4 /100 | #151 | Good 11.0% |
| Immigrants | Nepal | 67.3 /100 | #152 | Good 11.0% |
| Immigrants | Bosnia and Herzegovina | 65.2 /100 | #153 | Good 11.0% |