Senegalese vs Yakama Male Poverty
COMPARE
Senegalese
Yakama
Male Poverty
Male Poverty Comparison
Senegalese
Yakama
14.1%
MALE POVERTY
0.0/ 100
METRIC RATING
304th/ 347
METRIC RANK
15.3%
MALE POVERTY
0.0/ 100
METRIC RATING
325th/ 347
METRIC RANK
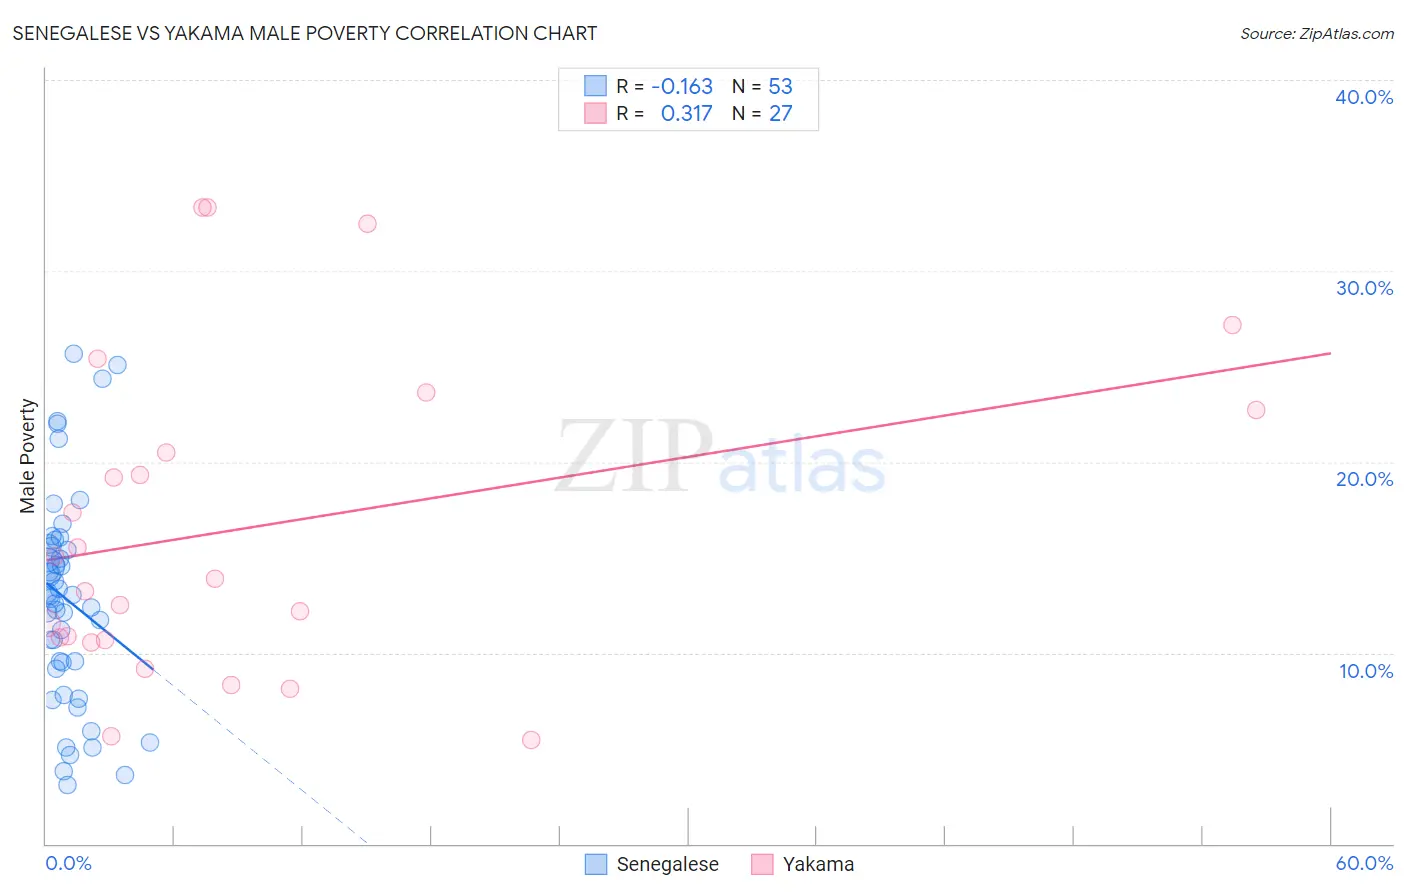
Senegalese vs Yakama Male Poverty Correlation Chart
The statistical analysis conducted on geographies consisting of 78,114,751 people shows a poor negative correlation between the proportion of Senegalese and poverty level among males in the United States with a correlation coefficient (R) of -0.163 and weighted average of 14.1%. Similarly, the statistical analysis conducted on geographies consisting of 19,917,879 people shows a mild positive correlation between the proportion of Yakama and poverty level among males in the United States with a correlation coefficient (R) of 0.317 and weighted average of 15.3%, a difference of 8.8%.
Male Poverty Correlation Summary
| Measurement | Senegalese | Yakama |
| Minimum | 3.1% | 5.5% |
| Maximum | 25.7% | 33.3% |
| Range | 22.6% | 27.9% |
| Mean | 12.8% | 16.6% |
| Median | 13.0% | 13.8% |
| Interquartile 25% (IQ1) | 9.3% | 10.7% |
| Interquartile 75% (IQ3) | 15.6% | 22.7% |
| Interquartile Range (IQR) | 6.3% | 12.1% |
| Standard Deviation (Sample) | 5.5% | 8.3% |
| Standard Deviation (Population) | 5.4% | 8.1% |
Similar Demographics by Male Poverty
Demographics Similar to Senegalese by Male Poverty
In terms of male poverty, the demographic groups most similar to Senegalese are Bahamian (14.1%, a difference of 0.10%), Immigrants from Caribbean (14.0%, a difference of 0.14%), Immigrants from Senegal (14.0%, a difference of 0.20%), Immigrants from Bangladesh (14.1%, a difference of 0.21%), and Immigrants from Mexico (14.0%, a difference of 0.27%).
| Demographics | Rating | Rank | Male Poverty |
| Inupiat | 0.0 /100 | #297 | Tragic 14.0% |
| Blackfeet | 0.0 /100 | #298 | Tragic 14.0% |
| Immigrants | Guatemala | 0.0 /100 | #299 | Tragic 14.0% |
| Immigrants | Mexico | 0.0 /100 | #300 | Tragic 14.0% |
| Immigrants | Senegal | 0.0 /100 | #301 | Tragic 14.0% |
| Immigrants | Caribbean | 0.0 /100 | #302 | Tragic 14.0% |
| Bahamians | 0.0 /100 | #303 | Tragic 14.1% |
| Senegalese | 0.0 /100 | #304 | Tragic 14.1% |
| Immigrants | Bangladesh | 0.0 /100 | #305 | Tragic 14.1% |
| Creek | 0.0 /100 | #306 | Tragic 14.1% |
| Dutch West Indians | 0.0 /100 | #307 | Tragic 14.2% |
| Africans | 0.0 /100 | #308 | Tragic 14.2% |
| Somalis | 0.0 /100 | #309 | Tragic 14.3% |
| Seminole | 0.0 /100 | #310 | Tragic 14.3% |
| Hondurans | 0.0 /100 | #311 | Tragic 14.3% |
Demographics Similar to Yakama by Male Poverty
In terms of male poverty, the demographic groups most similar to Yakama are Central American Indian (15.3%, a difference of 0.11%), Menominee (15.3%, a difference of 0.18%), Colville (15.2%, a difference of 0.37%), Kiowa (15.2%, a difference of 0.76%), and Arapaho (15.1%, a difference of 1.5%).
| Demographics | Rating | Rank | Male Poverty |
| Immigrants | Grenada | 0.0 /100 | #318 | Tragic 14.7% |
| U.S. Virgin Islanders | 0.0 /100 | #319 | Tragic 14.7% |
| Immigrants | Congo | 0.0 /100 | #320 | Tragic 14.7% |
| Arapaho | 0.0 /100 | #321 | Tragic 15.1% |
| Kiowa | 0.0 /100 | #322 | Tragic 15.2% |
| Colville | 0.0 /100 | #323 | Tragic 15.2% |
| Menominee | 0.0 /100 | #324 | Tragic 15.3% |
| Yakama | 0.0 /100 | #325 | Tragic 15.3% |
| Central American Indians | 0.0 /100 | #326 | Tragic 15.3% |
| Paiute | 0.0 /100 | #327 | Tragic 15.8% |
| Blacks/African Americans | 0.0 /100 | #328 | Tragic 15.8% |
| Dominicans | 0.0 /100 | #329 | Tragic 16.1% |
| Immigrants | Dominican Republic | 0.0 /100 | #330 | Tragic 16.2% |
| Ute | 0.0 /100 | #331 | Tragic 16.2% |
| Houma | 0.0 /100 | #332 | Tragic 16.7% |