Senegalese vs Immigrants from Sudan Family Poverty
COMPARE
Senegalese
Immigrants from Sudan
Family Poverty
Family Poverty Comparison
Senegalese
Immigrants from Sudan
11.5%
FAMILY POVERTY
0.0/ 100
METRIC RATING
286th/ 347
METRIC RANK
10.1%
FAMILY POVERTY
2.3/ 100
METRIC RATING
232nd/ 347
METRIC RANK
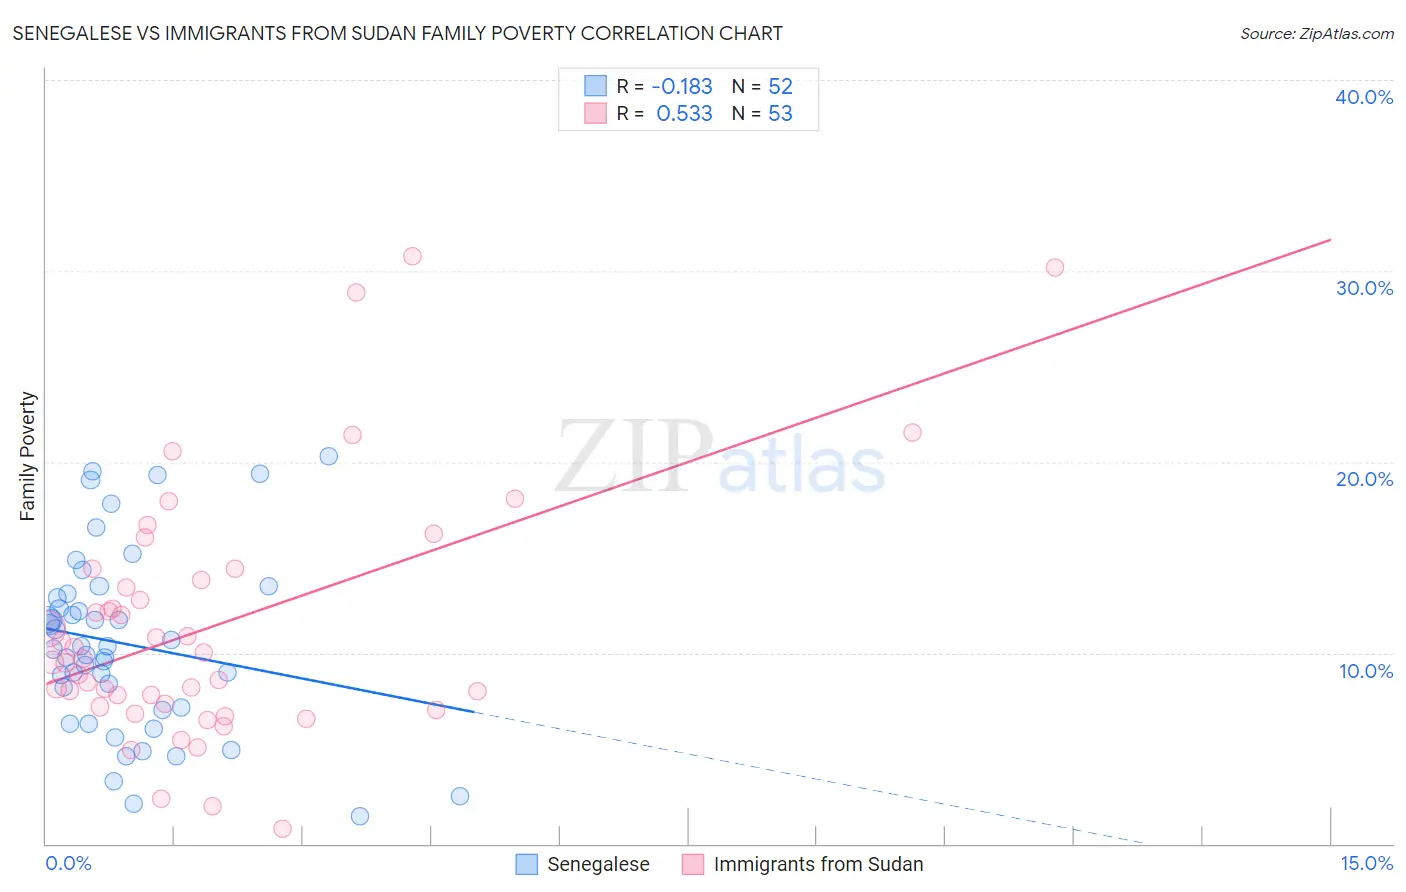
Senegalese vs Immigrants from Sudan Family Poverty Correlation Chart
The statistical analysis conducted on geographies consisting of 78,085,105 people shows a poor negative correlation between the proportion of Senegalese and poverty level among families in the United States with a correlation coefficient (R) of -0.183 and weighted average of 11.5%. Similarly, the statistical analysis conducted on geographies consisting of 118,923,711 people shows a substantial positive correlation between the proportion of Immigrants from Sudan and poverty level among families in the United States with a correlation coefficient (R) of 0.533 and weighted average of 10.1%, a difference of 13.5%.
Family Poverty Correlation Summary
| Measurement | Senegalese | Immigrants from Sudan |
| Minimum | 1.5% | 0.80% |
| Maximum | 20.3% | 30.8% |
| Range | 18.9% | 30.0% |
| Mean | 10.5% | 11.4% |
| Median | 10.3% | 9.7% |
| Interquartile 25% (IQ1) | 7.1% | 7.3% |
| Interquartile 75% (IQ3) | 13.0% | 14.1% |
| Interquartile Range (IQR) | 5.9% | 6.9% |
| Standard Deviation (Sample) | 4.7% | 6.5% |
| Standard Deviation (Population) | 4.7% | 6.4% |
Similar Demographics by Family Poverty
Demographics Similar to Senegalese by Family Poverty
In terms of family poverty, the demographic groups most similar to Senegalese are Vietnamese (11.5%, a difference of 0.27%), Immigrants from Belize (11.5%, a difference of 0.46%), Immigrants from Barbados (11.5%, a difference of 0.51%), West Indian (11.5%, a difference of 0.52%), and Haitian (11.5%, a difference of 0.58%).
| Demographics | Rating | Rank | Family Poverty |
| Blackfeet | 0.0 /100 | #279 | Tragic 11.3% |
| Belizeans | 0.0 /100 | #280 | Tragic 11.3% |
| Immigrants | West Indies | 0.0 /100 | #281 | Tragic 11.3% |
| Immigrants | Cuba | 0.0 /100 | #282 | Tragic 11.3% |
| Indonesians | 0.0 /100 | #283 | Tragic 11.3% |
| Yaqui | 0.0 /100 | #284 | Tragic 11.3% |
| Barbadians | 0.0 /100 | #285 | Tragic 11.3% |
| Senegalese | 0.0 /100 | #286 | Tragic 11.5% |
| Vietnamese | 0.0 /100 | #287 | Tragic 11.5% |
| Immigrants | Belize | 0.0 /100 | #288 | Tragic 11.5% |
| Immigrants | Barbados | 0.0 /100 | #289 | Tragic 11.5% |
| West Indians | 0.0 /100 | #290 | Tragic 11.5% |
| Haitians | 0.0 /100 | #291 | Tragic 11.5% |
| Immigrants | Somalia | 0.0 /100 | #292 | Tragic 11.5% |
| Immigrants | Cabo Verde | 0.0 /100 | #293 | Tragic 11.6% |
Demographics Similar to Immigrants from Sudan by Family Poverty
In terms of family poverty, the demographic groups most similar to Immigrants from Sudan are Fijian (10.1%, a difference of 0.25%), Immigrants from Middle Africa (10.1%, a difference of 0.36%), Nigerian (10.1%, a difference of 0.39%), Alaskan Athabascan (10.1%, a difference of 0.43%), and Immigrants from Nigeria (10.2%, a difference of 0.64%).
| Demographics | Rating | Rank | Family Poverty |
| Immigrants | Immigrants | 3.6 /100 | #225 | Tragic 10.0% |
| Ottawa | 3.3 /100 | #226 | Tragic 10.0% |
| Immigrants | Armenia | 3.3 /100 | #227 | Tragic 10.0% |
| Sudanese | 3.1 /100 | #228 | Tragic 10.0% |
| Immigrants | Uzbekistan | 3.1 /100 | #229 | Tragic 10.0% |
| Immigrants | Panama | 3.1 /100 | #230 | Tragic 10.0% |
| Alaskan Athabascans | 2.7 /100 | #231 | Tragic 10.1% |
| Immigrants | Sudan | 2.3 /100 | #232 | Tragic 10.1% |
| Fijians | 2.1 /100 | #233 | Tragic 10.1% |
| Immigrants | Middle Africa | 2.1 /100 | #234 | Tragic 10.1% |
| Nigerians | 2.0 /100 | #235 | Tragic 10.1% |
| Immigrants | Nigeria | 1.9 /100 | #236 | Tragic 10.2% |
| Immigrants | Laos | 1.7 /100 | #237 | Tragic 10.2% |
| French American Indians | 1.5 /100 | #238 | Tragic 10.2% |
| Potawatomi | 1.5 /100 | #239 | Tragic 10.2% |