Israeli vs Immigrants from Sudan Male Poverty
COMPARE
Israeli
Immigrants from Sudan
Male Poverty
Male Poverty Comparison
Israelis
Immigrants from Sudan
11.5%
MALE POVERTY
26.1/ 100
METRIC RATING
190th/ 347
METRIC RANK
12.9%
MALE POVERTY
0.2/ 100
METRIC RATING
248th/ 347
METRIC RANK
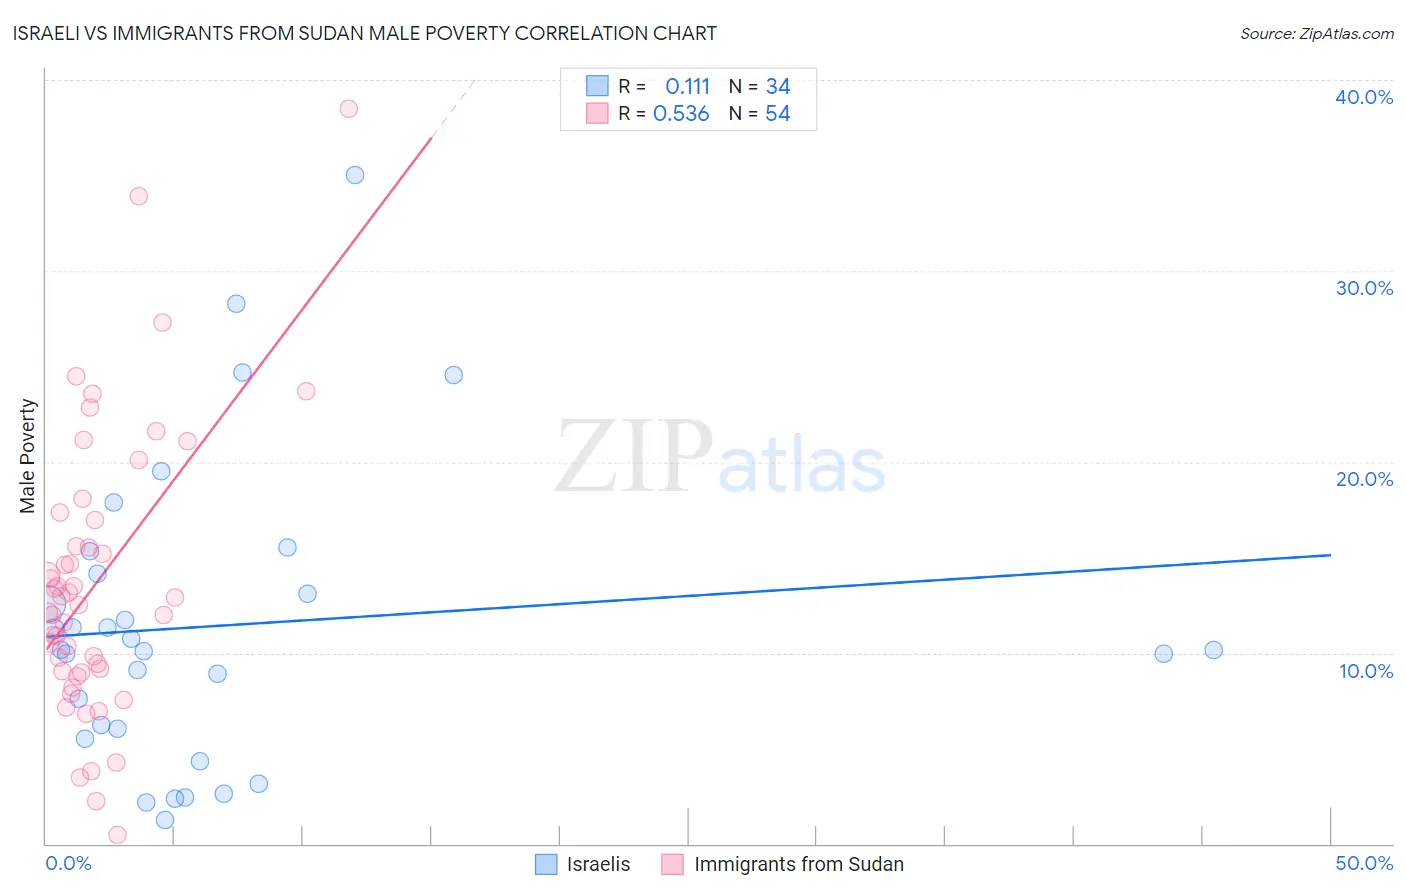
Israeli vs Immigrants from Sudan Male Poverty Correlation Chart
The statistical analysis conducted on geographies consisting of 210,981,593 people shows a poor positive correlation between the proportion of Israelis and poverty level among males in the United States with a correlation coefficient (R) of 0.111 and weighted average of 11.5%. Similarly, the statistical analysis conducted on geographies consisting of 118,946,491 people shows a substantial positive correlation between the proportion of Immigrants from Sudan and poverty level among males in the United States with a correlation coefficient (R) of 0.536 and weighted average of 12.9%, a difference of 12.4%.
Male Poverty Correlation Summary
| Measurement | Israeli | Immigrants from Sudan |
| Minimum | 1.2% | 0.44% |
| Maximum | 35.0% | 38.5% |
| Range | 33.8% | 38.1% |
| Mean | 11.4% | 13.7% |
| Median | 10.2% | 12.7% |
| Interquartile 25% (IQ1) | 6.0% | 9.0% |
| Interquartile 75% (IQ3) | 14.1% | 16.9% |
| Interquartile Range (IQR) | 8.1% | 7.9% |
| Standard Deviation (Sample) | 7.8% | 7.4% |
| Standard Deviation (Population) | 7.7% | 7.3% |
Similar Demographics by Male Poverty
Demographics Similar to Israelis by Male Poverty
In terms of male poverty, the demographic groups most similar to Israelis are Hawaiian (11.4%, a difference of 0.26%), South American Indian (11.5%, a difference of 0.43%), Sierra Leonean (11.4%, a difference of 0.45%), Immigrants from Iraq (11.4%, a difference of 0.67%), and Immigrants from Sierra Leone (11.4%, a difference of 0.79%).
| Demographics | Rating | Rank | Male Poverty |
| Kenyans | 38.4 /100 | #183 | Fair 11.3% |
| Immigrants | South America | 36.9 /100 | #184 | Fair 11.3% |
| Immigrants | Afghanistan | 33.3 /100 | #185 | Fair 11.4% |
| Immigrants | Sierra Leone | 32.9 /100 | #186 | Fair 11.4% |
| Immigrants | Iraq | 31.9 /100 | #187 | Fair 11.4% |
| Sierra Leoneans | 29.9 /100 | #188 | Fair 11.4% |
| Hawaiians | 28.3 /100 | #189 | Fair 11.4% |
| Israelis | 26.1 /100 | #190 | Fair 11.5% |
| South American Indians | 22.8 /100 | #191 | Fair 11.5% |
| Immigrants | Uruguay | 19.1 /100 | #192 | Poor 11.6% |
| Immigrants | Kuwait | 17.3 /100 | #193 | Poor 11.6% |
| Immigrants | Kenya | 16.1 /100 | #194 | Poor 11.6% |
| Arabs | 15.8 /100 | #195 | Poor 11.6% |
| Hmong | 15.8 /100 | #196 | Poor 11.6% |
| Delaware | 15.4 /100 | #197 | Poor 11.7% |
Demographics Similar to Immigrants from Sudan by Male Poverty
In terms of male poverty, the demographic groups most similar to Immigrants from Sudan are Immigrants from Western Africa (12.9%, a difference of 0.060%), Potawatomi (12.9%, a difference of 0.070%), Immigrants from Nicaragua (12.9%, a difference of 0.080%), Immigrants from Cuba (12.9%, a difference of 0.18%), and Immigrants from Ecuador (12.9%, a difference of 0.21%).
| Demographics | Rating | Rank | Male Poverty |
| Sudanese | 0.3 /100 | #241 | Tragic 12.8% |
| Nepalese | 0.3 /100 | #242 | Tragic 12.8% |
| Alaskan Athabascans | 0.3 /100 | #243 | Tragic 12.8% |
| Tsimshian | 0.3 /100 | #244 | Tragic 12.8% |
| Liberians | 0.3 /100 | #245 | Tragic 12.8% |
| Immigrants | El Salvador | 0.2 /100 | #246 | Tragic 12.8% |
| Immigrants | Western Africa | 0.2 /100 | #247 | Tragic 12.9% |
| Immigrants | Sudan | 0.2 /100 | #248 | Tragic 12.9% |
| Potawatomi | 0.2 /100 | #249 | Tragic 12.9% |
| Immigrants | Nicaragua | 0.2 /100 | #250 | Tragic 12.9% |
| Immigrants | Cuba | 0.2 /100 | #251 | Tragic 12.9% |
| Immigrants | Ecuador | 0.2 /100 | #252 | Tragic 12.9% |
| Immigrants | Ghana | 0.2 /100 | #253 | Tragic 12.9% |
| Mexican American Indians | 0.1 /100 | #254 | Tragic 13.0% |
| Immigrants | Liberia | 0.1 /100 | #255 | Tragic 13.0% |