Lithuanian vs Immigrants from Sudan Male Poverty
COMPARE
Lithuanian
Immigrants from Sudan
Male Poverty
Male Poverty Comparison
Lithuanians
Immigrants from Sudan
9.5%
MALE POVERTY
99.8/ 100
METRIC RATING
18th/ 347
METRIC RANK
12.9%
MALE POVERTY
0.2/ 100
METRIC RATING
248th/ 347
METRIC RANK
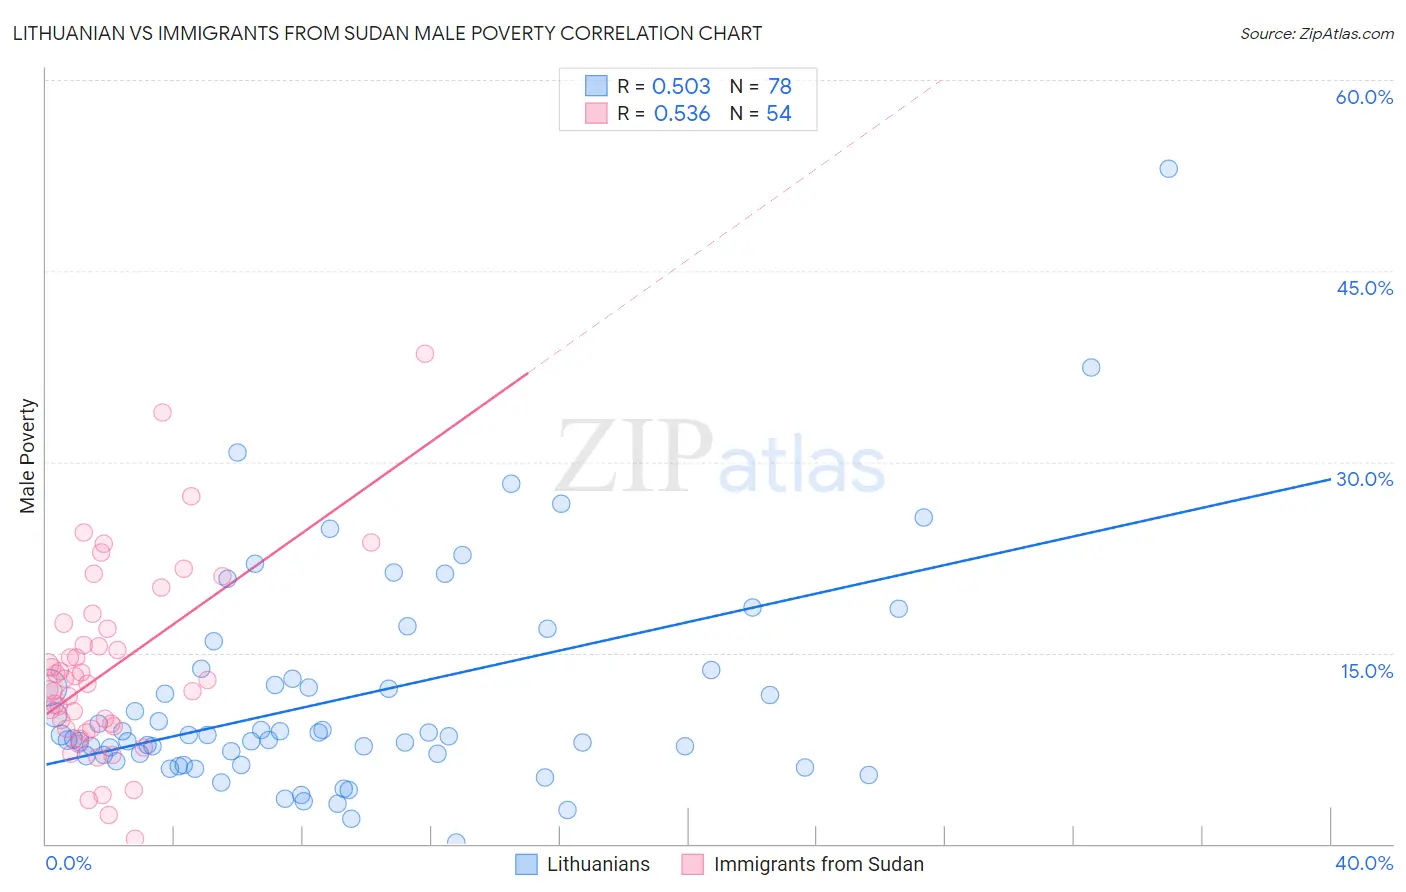
Lithuanian vs Immigrants from Sudan Male Poverty Correlation Chart
The statistical analysis conducted on geographies consisting of 421,480,494 people shows a substantial positive correlation between the proportion of Lithuanians and poverty level among males in the United States with a correlation coefficient (R) of 0.503 and weighted average of 9.5%. Similarly, the statistical analysis conducted on geographies consisting of 118,946,491 people shows a substantial positive correlation between the proportion of Immigrants from Sudan and poverty level among males in the United States with a correlation coefficient (R) of 0.536 and weighted average of 12.9%, a difference of 35.1%.
Male Poverty Correlation Summary
| Measurement | Lithuanian | Immigrants from Sudan |
| Minimum | 0.15% | 0.44% |
| Maximum | 53.0% | 38.5% |
| Range | 52.8% | 38.1% |
| Mean | 11.4% | 13.7% |
| Median | 8.5% | 12.7% |
| Interquartile 25% (IQ1) | 6.9% | 9.0% |
| Interquartile 75% (IQ3) | 13.0% | 16.9% |
| Interquartile Range (IQR) | 6.0% | 7.9% |
| Standard Deviation (Sample) | 8.6% | 7.4% |
| Standard Deviation (Population) | 8.6% | 7.3% |
Similar Demographics by Male Poverty
Demographics Similar to Lithuanians by Male Poverty
In terms of male poverty, the demographic groups most similar to Lithuanians are Norwegian (9.5%, a difference of 0.17%), Immigrants from Hong Kong (9.6%, a difference of 0.18%), Latvian (9.6%, a difference of 0.28%), Luxembourger (9.5%, a difference of 0.30%), and Immigrants from Scotland (9.6%, a difference of 0.55%).
| Demographics | Rating | Rank | Male Poverty |
| Bolivians | 99.9 /100 | #11 | Exceptional 9.4% |
| Immigrants | Bolivia | 99.9 /100 | #12 | Exceptional 9.4% |
| Immigrants | Lithuania | 99.9 /100 | #13 | Exceptional 9.4% |
| Immigrants | North Macedonia | 99.8 /100 | #14 | Exceptional 9.4% |
| Bhutanese | 99.8 /100 | #15 | Exceptional 9.5% |
| Luxembourgers | 99.8 /100 | #16 | Exceptional 9.5% |
| Norwegians | 99.8 /100 | #17 | Exceptional 9.5% |
| Lithuanians | 99.8 /100 | #18 | Exceptional 9.5% |
| Immigrants | Hong Kong | 99.7 /100 | #19 | Exceptional 9.6% |
| Latvians | 99.7 /100 | #20 | Exceptional 9.6% |
| Immigrants | Scotland | 99.7 /100 | #21 | Exceptional 9.6% |
| Croatians | 99.7 /100 | #22 | Exceptional 9.6% |
| Italians | 99.7 /100 | #23 | Exceptional 9.6% |
| Swedes | 99.7 /100 | #24 | Exceptional 9.6% |
| Eastern Europeans | 99.6 /100 | #25 | Exceptional 9.6% |
Demographics Similar to Immigrants from Sudan by Male Poverty
In terms of male poverty, the demographic groups most similar to Immigrants from Sudan are Immigrants from Western Africa (12.9%, a difference of 0.060%), Potawatomi (12.9%, a difference of 0.070%), Immigrants from Nicaragua (12.9%, a difference of 0.080%), Immigrants from Cuba (12.9%, a difference of 0.18%), and Immigrants from Ecuador (12.9%, a difference of 0.21%).
| Demographics | Rating | Rank | Male Poverty |
| Sudanese | 0.3 /100 | #241 | Tragic 12.8% |
| Nepalese | 0.3 /100 | #242 | Tragic 12.8% |
| Alaskan Athabascans | 0.3 /100 | #243 | Tragic 12.8% |
| Tsimshian | 0.3 /100 | #244 | Tragic 12.8% |
| Liberians | 0.3 /100 | #245 | Tragic 12.8% |
| Immigrants | El Salvador | 0.2 /100 | #246 | Tragic 12.8% |
| Immigrants | Western Africa | 0.2 /100 | #247 | Tragic 12.9% |
| Immigrants | Sudan | 0.2 /100 | #248 | Tragic 12.9% |
| Potawatomi | 0.2 /100 | #249 | Tragic 12.9% |
| Immigrants | Nicaragua | 0.2 /100 | #250 | Tragic 12.9% |
| Immigrants | Cuba | 0.2 /100 | #251 | Tragic 12.9% |
| Immigrants | Ecuador | 0.2 /100 | #252 | Tragic 12.9% |
| Immigrants | Ghana | 0.2 /100 | #253 | Tragic 12.9% |
| Mexican American Indians | 0.1 /100 | #254 | Tragic 13.0% |
| Immigrants | Liberia | 0.1 /100 | #255 | Tragic 13.0% |