Immigrants from West Indies vs Immigrants from Sudan Male Poverty
COMPARE
Immigrants from West Indies
Immigrants from Sudan
Male Poverty
Male Poverty Comparison
Immigrants from West Indies
Immigrants from Sudan
13.5%
MALE POVERTY
0.0/ 100
METRIC RATING
274th/ 347
METRIC RANK
12.9%
MALE POVERTY
0.2/ 100
METRIC RATING
248th/ 347
METRIC RANK
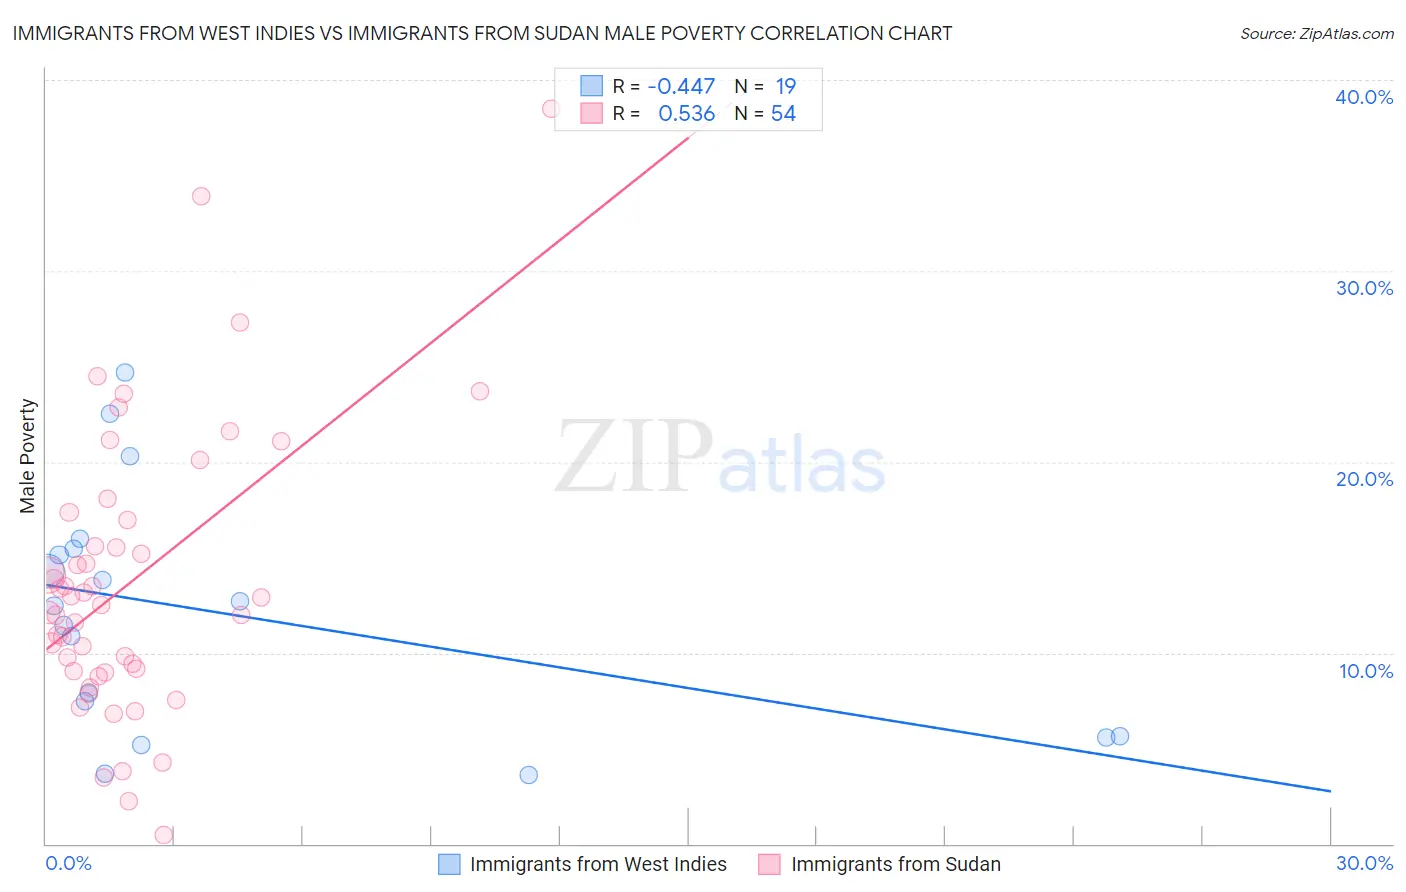
Immigrants from West Indies vs Immigrants from Sudan Male Poverty Correlation Chart
The statistical analysis conducted on geographies consisting of 72,454,628 people shows a moderate negative correlation between the proportion of Immigrants from West Indies and poverty level among males in the United States with a correlation coefficient (R) of -0.447 and weighted average of 13.5%. Similarly, the statistical analysis conducted on geographies consisting of 118,946,491 people shows a substantial positive correlation between the proportion of Immigrants from Sudan and poverty level among males in the United States with a correlation coefficient (R) of 0.536 and weighted average of 12.9%, a difference of 4.7%.
Male Poverty Correlation Summary
| Measurement | Immigrants from West Indies | Immigrants from Sudan |
| Minimum | 3.6% | 0.44% |
| Maximum | 24.7% | 38.5% |
| Range | 21.1% | 38.1% |
| Mean | 12.0% | 13.7% |
| Median | 12.5% | 12.7% |
| Interquartile 25% (IQ1) | 5.6% | 9.0% |
| Interquartile 75% (IQ3) | 15.4% | 16.9% |
| Interquartile Range (IQR) | 9.8% | 7.9% |
| Standard Deviation (Sample) | 6.2% | 7.4% |
| Standard Deviation (Population) | 6.0% | 7.3% |
Similar Demographics by Male Poverty
Demographics Similar to Immigrants from West Indies by Male Poverty
In terms of male poverty, the demographic groups most similar to Immigrants from West Indies are Chickasaw (13.5%, a difference of 0.070%), Immigrants from Bahamas (13.5%, a difference of 0.37%), Barbadian (13.6%, a difference of 0.62%), Immigrants from Latin America (13.6%, a difference of 0.82%), and Bangladeshi (13.6%, a difference of 0.97%).
| Demographics | Rating | Rank | Male Poverty |
| Immigrants | Jamaica | 0.1 /100 | #267 | Tragic 13.3% |
| Sub-Saharan Africans | 0.1 /100 | #268 | Tragic 13.3% |
| Guyanese | 0.0 /100 | #269 | Tragic 13.3% |
| Cree | 0.0 /100 | #270 | Tragic 13.3% |
| Spanish Americans | 0.0 /100 | #271 | Tragic 13.4% |
| Immigrants | Bahamas | 0.0 /100 | #272 | Tragic 13.5% |
| Chickasaw | 0.0 /100 | #273 | Tragic 13.5% |
| Immigrants | West Indies | 0.0 /100 | #274 | Tragic 13.5% |
| Barbadians | 0.0 /100 | #275 | Tragic 13.6% |
| Immigrants | Latin America | 0.0 /100 | #276 | Tragic 13.6% |
| Bangladeshis | 0.0 /100 | #277 | Tragic 13.6% |
| Belizeans | 0.0 /100 | #278 | Tragic 13.6% |
| Haitians | 0.0 /100 | #279 | Tragic 13.7% |
| Mexicans | 0.0 /100 | #280 | Tragic 13.7% |
| Yaqui | 0.0 /100 | #281 | Tragic 13.7% |
Demographics Similar to Immigrants from Sudan by Male Poverty
In terms of male poverty, the demographic groups most similar to Immigrants from Sudan are Immigrants from Western Africa (12.9%, a difference of 0.060%), Potawatomi (12.9%, a difference of 0.070%), Immigrants from Nicaragua (12.9%, a difference of 0.080%), Immigrants from Cuba (12.9%, a difference of 0.18%), and Immigrants from Ecuador (12.9%, a difference of 0.21%).
| Demographics | Rating | Rank | Male Poverty |
| Sudanese | 0.3 /100 | #241 | Tragic 12.8% |
| Nepalese | 0.3 /100 | #242 | Tragic 12.8% |
| Alaskan Athabascans | 0.3 /100 | #243 | Tragic 12.8% |
| Tsimshian | 0.3 /100 | #244 | Tragic 12.8% |
| Liberians | 0.3 /100 | #245 | Tragic 12.8% |
| Immigrants | El Salvador | 0.2 /100 | #246 | Tragic 12.8% |
| Immigrants | Western Africa | 0.2 /100 | #247 | Tragic 12.9% |
| Immigrants | Sudan | 0.2 /100 | #248 | Tragic 12.9% |
| Potawatomi | 0.2 /100 | #249 | Tragic 12.9% |
| Immigrants | Nicaragua | 0.2 /100 | #250 | Tragic 12.9% |
| Immigrants | Cuba | 0.2 /100 | #251 | Tragic 12.9% |
| Immigrants | Ecuador | 0.2 /100 | #252 | Tragic 12.9% |
| Immigrants | Ghana | 0.2 /100 | #253 | Tragic 12.9% |
| Mexican American Indians | 0.1 /100 | #254 | Tragic 13.0% |
| Immigrants | Liberia | 0.1 /100 | #255 | Tragic 13.0% |