Osage vs Immigrants from Sudan Male Poverty
COMPARE
Osage
Immigrants from Sudan
Male Poverty
Male Poverty Comparison
Osage
Immigrants from Sudan
12.3%
MALE POVERTY
1.5/ 100
METRIC RATING
225th/ 347
METRIC RANK
12.9%
MALE POVERTY
0.2/ 100
METRIC RATING
248th/ 347
METRIC RANK
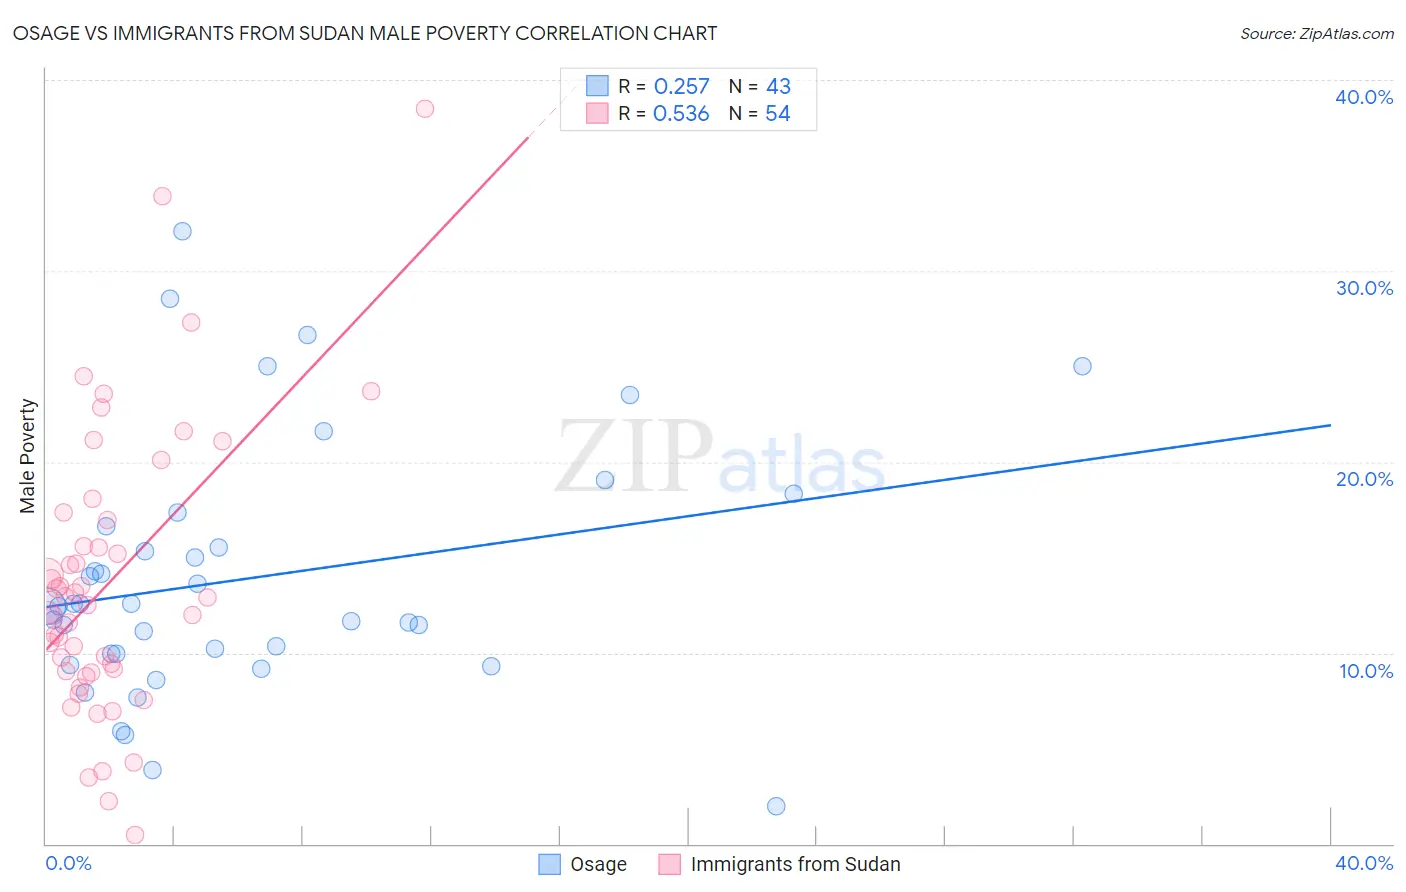
Osage vs Immigrants from Sudan Male Poverty Correlation Chart
The statistical analysis conducted on geographies consisting of 91,789,808 people shows a weak positive correlation between the proportion of Osage and poverty level among males in the United States with a correlation coefficient (R) of 0.257 and weighted average of 12.3%. Similarly, the statistical analysis conducted on geographies consisting of 118,946,491 people shows a substantial positive correlation between the proportion of Immigrants from Sudan and poverty level among males in the United States with a correlation coefficient (R) of 0.536 and weighted average of 12.9%, a difference of 4.6%.
Male Poverty Correlation Summary
| Measurement | Osage | Immigrants from Sudan |
| Minimum | 1.9% | 0.44% |
| Maximum | 32.1% | 38.5% |
| Range | 30.2% | 38.1% |
| Mean | 13.9% | 13.7% |
| Median | 12.4% | 12.7% |
| Interquartile 25% (IQ1) | 9.9% | 9.0% |
| Interquartile 75% (IQ3) | 16.6% | 16.9% |
| Interquartile Range (IQR) | 6.7% | 7.9% |
| Standard Deviation (Sample) | 6.6% | 7.4% |
| Standard Deviation (Population) | 6.5% | 7.3% |
Similar Demographics by Male Poverty
Demographics Similar to Osage by Male Poverty
In terms of male poverty, the demographic groups most similar to Osage are Immigrants from Nigeria (12.3%, a difference of 0.060%), Nigerian (12.3%, a difference of 0.17%), Alaska Native (12.4%, a difference of 0.26%), Alsatian (12.4%, a difference of 0.30%), and Cuban (12.4%, a difference of 0.39%).
| Demographics | Rating | Rank | Male Poverty |
| German Russians | 2.5 /100 | #218 | Tragic 12.2% |
| Bermudans | 2.4 /100 | #219 | Tragic 12.2% |
| Immigrants | Eritrea | 2.4 /100 | #220 | Tragic 12.2% |
| Ugandans | 2.2 /100 | #221 | Tragic 12.2% |
| Immigrants | Africa | 2.1 /100 | #222 | Tragic 12.2% |
| Immigrants | Micronesia | 2.1 /100 | #223 | Tragic 12.2% |
| Immigrants | Nigeria | 1.6 /100 | #224 | Tragic 12.3% |
| Osage | 1.5 /100 | #225 | Tragic 12.3% |
| Nigerians | 1.4 /100 | #226 | Tragic 12.3% |
| Alaska Natives | 1.4 /100 | #227 | Tragic 12.4% |
| Alsatians | 1.3 /100 | #228 | Tragic 12.4% |
| Cubans | 1.3 /100 | #229 | Tragic 12.4% |
| Marshallese | 0.8 /100 | #230 | Tragic 12.5% |
| Salvadorans | 0.6 /100 | #231 | Tragic 12.6% |
| Nicaraguans | 0.6 /100 | #232 | Tragic 12.6% |
Demographics Similar to Immigrants from Sudan by Male Poverty
In terms of male poverty, the demographic groups most similar to Immigrants from Sudan are Immigrants from Western Africa (12.9%, a difference of 0.060%), Potawatomi (12.9%, a difference of 0.070%), Immigrants from Nicaragua (12.9%, a difference of 0.080%), Immigrants from Cuba (12.9%, a difference of 0.18%), and Immigrants from Ecuador (12.9%, a difference of 0.21%).
| Demographics | Rating | Rank | Male Poverty |
| Sudanese | 0.3 /100 | #241 | Tragic 12.8% |
| Nepalese | 0.3 /100 | #242 | Tragic 12.8% |
| Alaskan Athabascans | 0.3 /100 | #243 | Tragic 12.8% |
| Tsimshian | 0.3 /100 | #244 | Tragic 12.8% |
| Liberians | 0.3 /100 | #245 | Tragic 12.8% |
| Immigrants | El Salvador | 0.2 /100 | #246 | Tragic 12.8% |
| Immigrants | Western Africa | 0.2 /100 | #247 | Tragic 12.9% |
| Immigrants | Sudan | 0.2 /100 | #248 | Tragic 12.9% |
| Potawatomi | 0.2 /100 | #249 | Tragic 12.9% |
| Immigrants | Nicaragua | 0.2 /100 | #250 | Tragic 12.9% |
| Immigrants | Cuba | 0.2 /100 | #251 | Tragic 12.9% |
| Immigrants | Ecuador | 0.2 /100 | #252 | Tragic 12.9% |
| Immigrants | Ghana | 0.2 /100 | #253 | Tragic 12.9% |
| Mexican American Indians | 0.1 /100 | #254 | Tragic 13.0% |
| Immigrants | Liberia | 0.1 /100 | #255 | Tragic 13.0% |