Senegalese vs Dominican Receiving Food Stamps
COMPARE
Senegalese
Dominican
Receiving Food Stamps
Receiving Food Stamps Comparison
Senegalese
Dominicans
15.4%
RECEIVING FOOD STAMPS
0.0/ 100
METRIC RATING
290th/ 347
METRIC RANK
21.4%
RECEIVING FOOD STAMPS
0.0/ 100
METRIC RATING
338th/ 347
METRIC RANK
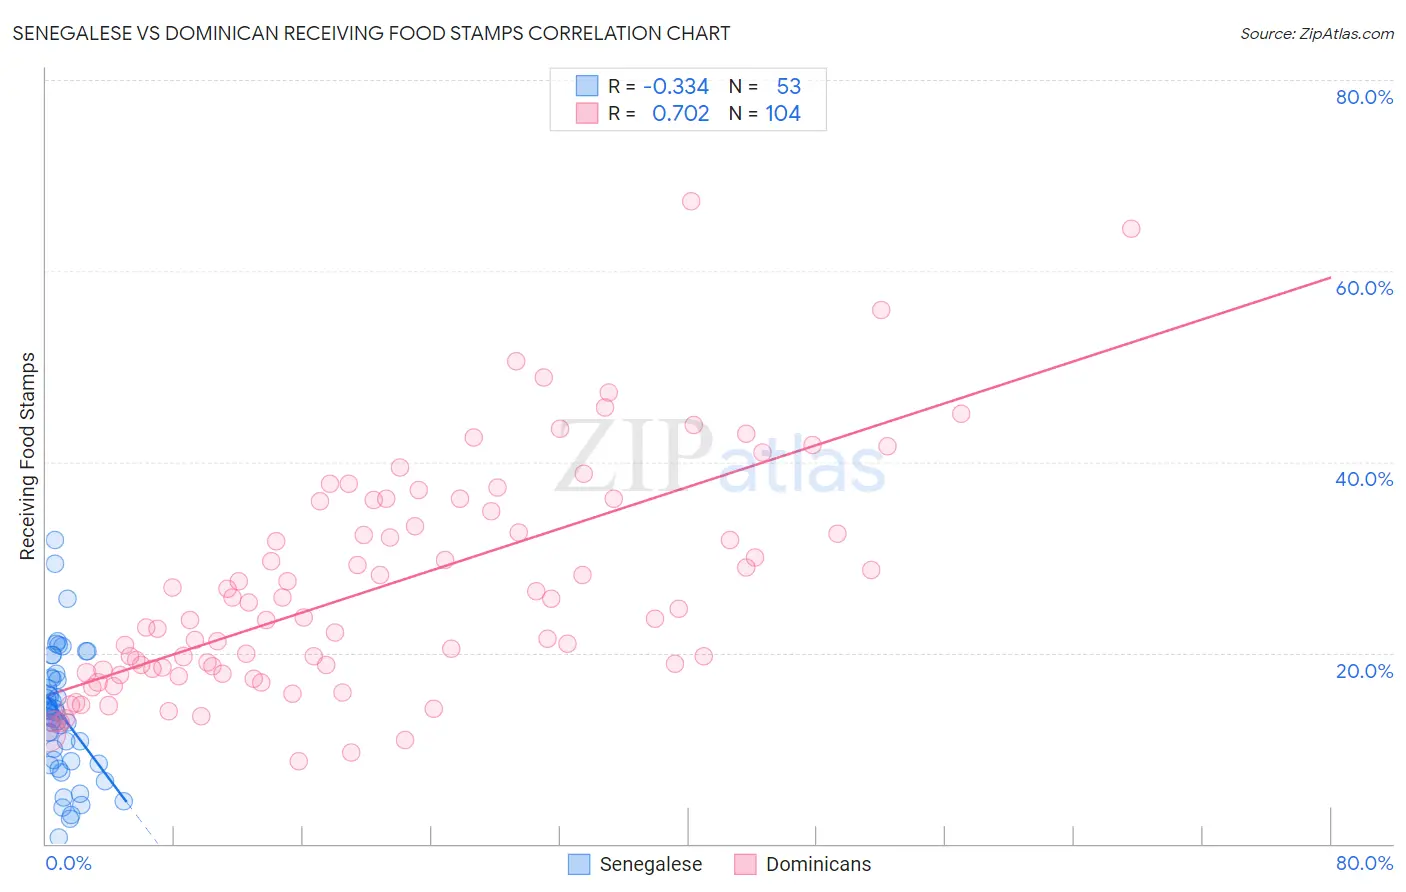
Senegalese vs Dominican Receiving Food Stamps Correlation Chart
The statistical analysis conducted on geographies consisting of 78,101,043 people shows a mild negative correlation between the proportion of Senegalese and percentage of population receiving government assistance and/or food stamps in the United States with a correlation coefficient (R) of -0.334 and weighted average of 15.4%. Similarly, the statistical analysis conducted on geographies consisting of 353,995,756 people shows a strong positive correlation between the proportion of Dominicans and percentage of population receiving government assistance and/or food stamps in the United States with a correlation coefficient (R) of 0.702 and weighted average of 21.4%, a difference of 38.8%.
Receiving Food Stamps Correlation Summary
| Measurement | Senegalese | Dominican |
| Minimum | 0.60% | 8.7% |
| Maximum | 31.8% | 67.3% |
| Range | 31.2% | 58.6% |
| Mean | 13.5% | 27.0% |
| Median | 13.7% | 24.1% |
| Interquartile 25% (IQ1) | 8.6% | 18.3% |
| Interquartile 75% (IQ3) | 17.4% | 35.4% |
| Interquartile Range (IQR) | 8.8% | 17.1% |
| Standard Deviation (Sample) | 6.6% | 11.8% |
| Standard Deviation (Population) | 6.5% | 11.7% |
Similar Demographics by Receiving Food Stamps
Demographics Similar to Senegalese by Receiving Food Stamps
In terms of receiving food stamps, the demographic groups most similar to Senegalese are Immigrants from Senegal (15.3%, a difference of 0.27%), Honduran (15.5%, a difference of 1.0%), Immigrants from Belize (15.2%, a difference of 1.0%), Alaska Native (15.6%, a difference of 1.5%), and Immigrants from Mexico (15.2%, a difference of 1.5%).
| Demographics | Rating | Rank | Receiving Food Stamps |
| Bangladeshis | 0.0 /100 | #283 | Tragic 15.0% |
| Immigrants | Ecuador | 0.0 /100 | #284 | Tragic 15.0% |
| Immigrants | Liberia | 0.0 /100 | #285 | Tragic 15.1% |
| Africans | 0.0 /100 | #286 | Tragic 15.1% |
| Immigrants | Mexico | 0.0 /100 | #287 | Tragic 15.2% |
| Immigrants | Belize | 0.0 /100 | #288 | Tragic 15.2% |
| Immigrants | Senegal | 0.0 /100 | #289 | Tragic 15.3% |
| Senegalese | 0.0 /100 | #290 | Tragic 15.4% |
| Hondurans | 0.0 /100 | #291 | Tragic 15.5% |
| Alaska Natives | 0.0 /100 | #292 | Tragic 15.6% |
| Vietnamese | 0.0 /100 | #293 | Tragic 15.7% |
| Immigrants | Latin America | 0.0 /100 | #294 | Tragic 15.7% |
| Immigrants | Honduras | 0.0 /100 | #295 | Tragic 15.7% |
| Tsimshian | 0.0 /100 | #296 | Tragic 15.7% |
| Immigrants | Bahamas | 0.0 /100 | #297 | Tragic 15.8% |
Demographics Similar to Dominicans by Receiving Food Stamps
In terms of receiving food stamps, the demographic groups most similar to Dominicans are Yakama (21.4%, a difference of 0.26%), Tohono O'odham (21.5%, a difference of 0.52%), Hopi (21.6%, a difference of 0.89%), Immigrants from Yemen (21.6%, a difference of 1.3%), and Cape Verdean (21.1%, a difference of 1.4%).
| Demographics | Rating | Rank | Receiving Food Stamps |
| Immigrants | Caribbean | 0.0 /100 | #331 | Tragic 19.6% |
| Pueblo | 0.0 /100 | #332 | Tragic 19.9% |
| Inupiat | 0.0 /100 | #333 | Tragic 20.1% |
| Yuman | 0.0 /100 | #334 | Tragic 20.2% |
| Immigrants | Cuba | 0.0 /100 | #335 | Tragic 20.8% |
| Navajo | 0.0 /100 | #336 | Tragic 21.1% |
| Cape Verdeans | 0.0 /100 | #337 | Tragic 21.1% |
| Dominicans | 0.0 /100 | #338 | Tragic 21.4% |
| Yakama | 0.0 /100 | #339 | Tragic 21.4% |
| Tohono O'odham | 0.0 /100 | #340 | Tragic 21.5% |
| Hopi | 0.0 /100 | #341 | Tragic 21.6% |
| Immigrants | Yemen | 0.0 /100 | #342 | Tragic 21.6% |
| Immigrants | Dominican Republic | 0.0 /100 | #343 | Tragic 22.1% |
| Lumbee | 0.0 /100 | #344 | Tragic 22.9% |
| Immigrants | Cabo Verde | 0.0 /100 | #345 | Tragic 23.8% |