Seminole vs Immigrants from Northern Europe Single Male Poverty
COMPARE
Seminole
Immigrants from Northern Europe
Single Male Poverty
Single Male Poverty Comparison
Seminole
Immigrants from Northern Europe
16.0%
SINGLE MALE POVERTY
0.0/ 100
METRIC RATING
311th/ 347
METRIC RANK
12.5%
SINGLE MALE POVERTY
83.7/ 100
METRIC RATING
131st/ 347
METRIC RANK
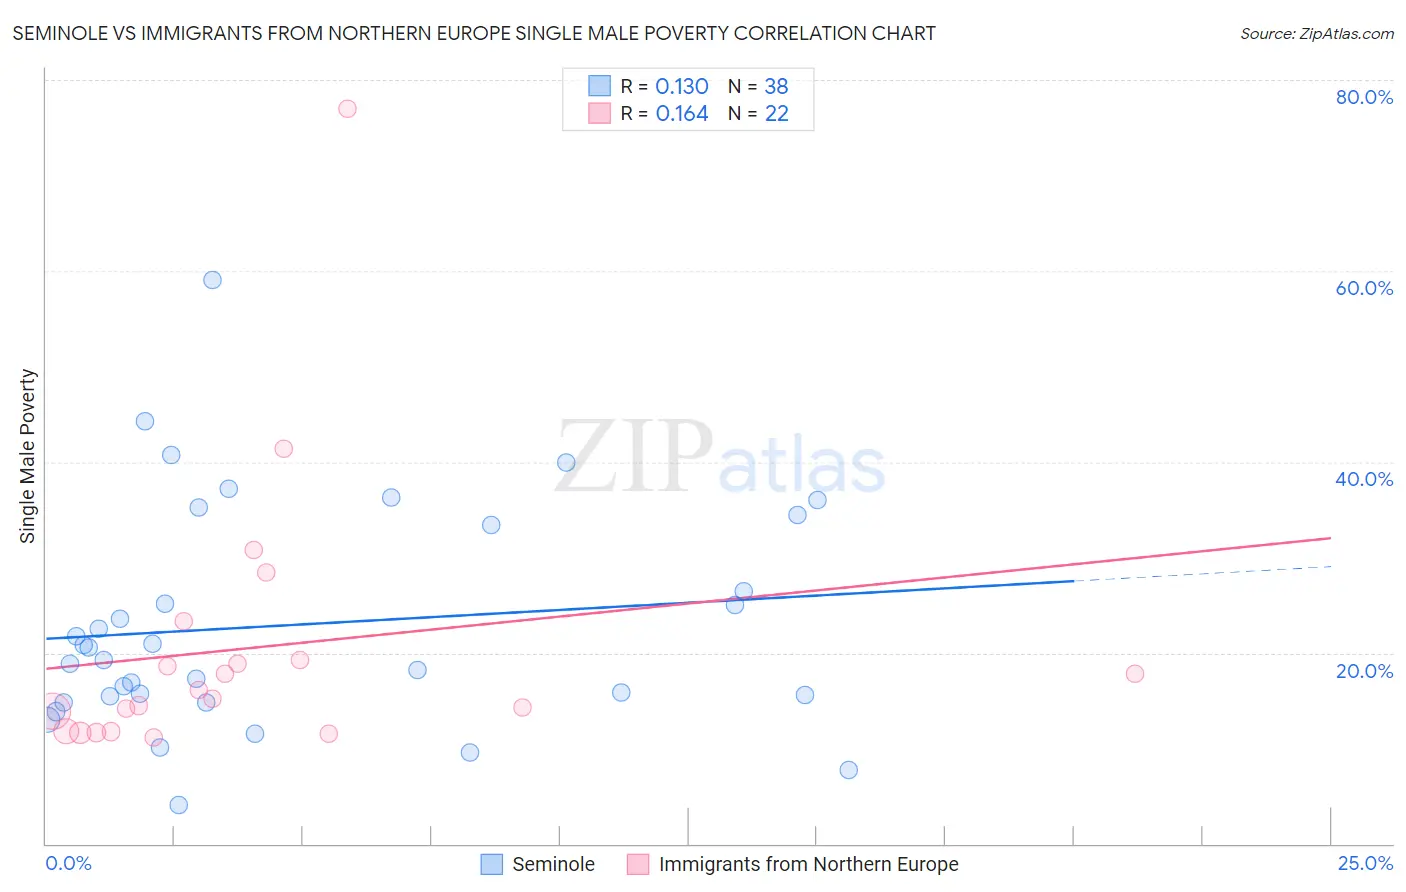
Seminole vs Immigrants from Northern Europe Single Male Poverty Correlation Chart
The statistical analysis conducted on geographies consisting of 113,333,266 people shows a poor positive correlation between the proportion of Seminole and poverty level among single males in the United States with a correlation coefficient (R) of 0.130 and weighted average of 16.0%. Similarly, the statistical analysis conducted on geographies consisting of 409,181,211 people shows a poor positive correlation between the proportion of Immigrants from Northern Europe and poverty level among single males in the United States with a correlation coefficient (R) of 0.164 and weighted average of 12.5%, a difference of 27.9%.
Single Male Poverty Correlation Summary
| Measurement | Seminole | Immigrants from Northern Europe |
| Minimum | 4.0% | 11.1% |
| Maximum | 59.1% | 77.0% |
| Range | 55.1% | 66.0% |
| Mean | 22.9% | 20.5% |
| Median | 19.9% | 15.7% |
| Interquartile 25% (IQ1) | 15.5% | 11.8% |
| Interquartile 75% (IQ3) | 33.3% | 19.2% |
| Interquartile Range (IQR) | 17.9% | 7.4% |
| Standard Deviation (Sample) | 11.7% | 14.7% |
| Standard Deviation (Population) | 11.6% | 14.3% |
Similar Demographics by Single Male Poverty
Demographics Similar to Seminole by Single Male Poverty
In terms of single male poverty, the demographic groups most similar to Seminole are Comanche (16.0%, a difference of 0.0%), Cherokee (16.1%, a difference of 0.23%), Alaskan Athabascan (16.1%, a difference of 0.52%), Yakama (15.9%, a difference of 0.54%), and Cheyenne (16.1%, a difference of 0.57%).
| Demographics | Rating | Rank | Single Male Poverty |
| Alaska Natives | 0.0 /100 | #304 | Tragic 15.4% |
| Blackfeet | 0.0 /100 | #305 | Tragic 15.5% |
| Pennsylvania Germans | 0.0 /100 | #306 | Tragic 15.6% |
| Ute | 0.0 /100 | #307 | Tragic 15.7% |
| Potawatomi | 0.0 /100 | #308 | Tragic 15.8% |
| Americans | 0.0 /100 | #309 | Tragic 15.8% |
| Yakama | 0.0 /100 | #310 | Tragic 15.9% |
| Seminole | 0.0 /100 | #311 | Tragic 16.0% |
| Comanche | 0.0 /100 | #312 | Tragic 16.0% |
| Cherokee | 0.0 /100 | #313 | Tragic 16.1% |
| Alaskan Athabascans | 0.0 /100 | #314 | Tragic 16.1% |
| Cheyenne | 0.0 /100 | #315 | Tragic 16.1% |
| Dutch West Indians | 0.0 /100 | #316 | Tragic 16.1% |
| Blacks/African Americans | 0.0 /100 | #317 | Tragic 16.2% |
| Chickasaw | 0.0 /100 | #318 | Tragic 16.3% |
Demographics Similar to Immigrants from Northern Europe by Single Male Poverty
In terms of single male poverty, the demographic groups most similar to Immigrants from Northern Europe are Salvadoran (12.5%, a difference of 0.0%), Immigrants from Western Asia (12.5%, a difference of 0.030%), Immigrants from Nicaragua (12.5%, a difference of 0.11%), Immigrants from Ecuador (12.5%, a difference of 0.15%), and Immigrants from Costa Rica (12.5%, a difference of 0.17%).
| Demographics | Rating | Rank | Single Male Poverty |
| Russians | 87.3 /100 | #124 | Excellent 12.5% |
| Immigrants | Jordan | 87.1 /100 | #125 | Excellent 12.5% |
| Romanians | 86.4 /100 | #126 | Excellent 12.5% |
| Immigrants | Netherlands | 86.2 /100 | #127 | Excellent 12.5% |
| Ecuadorians | 85.9 /100 | #128 | Excellent 12.5% |
| Immigrants | Sierra Leone | 85.5 /100 | #129 | Excellent 12.5% |
| Immigrants | Nicaragua | 84.8 /100 | #130 | Excellent 12.5% |
| Immigrants | Northern Europe | 83.7 /100 | #131 | Excellent 12.5% |
| Salvadorans | 83.7 /100 | #132 | Excellent 12.5% |
| Immigrants | Western Asia | 83.4 /100 | #133 | Excellent 12.5% |
| Immigrants | Ecuador | 82.1 /100 | #134 | Excellent 12.5% |
| Immigrants | Costa Rica | 81.9 /100 | #135 | Excellent 12.5% |
| Immigrants | Austria | 81.9 /100 | #136 | Excellent 12.5% |
| Ukrainians | 80.7 /100 | #137 | Excellent 12.6% |
| Immigrants | El Salvador | 80.0 /100 | #138 | Excellent 12.6% |