Lithuanian vs Immigrants from Israel Single Male Poverty
COMPARE
Lithuanian
Immigrants from Israel
Single Male Poverty
Single Male Poverty Comparison
Lithuanians
Immigrants from Israel
13.0%
SINGLE MALE POVERTY
22.1/ 100
METRIC RATING
198th/ 347
METRIC RANK
12.1%
SINGLE MALE POVERTY
98.5/ 100
METRIC RATING
86th/ 347
METRIC RANK
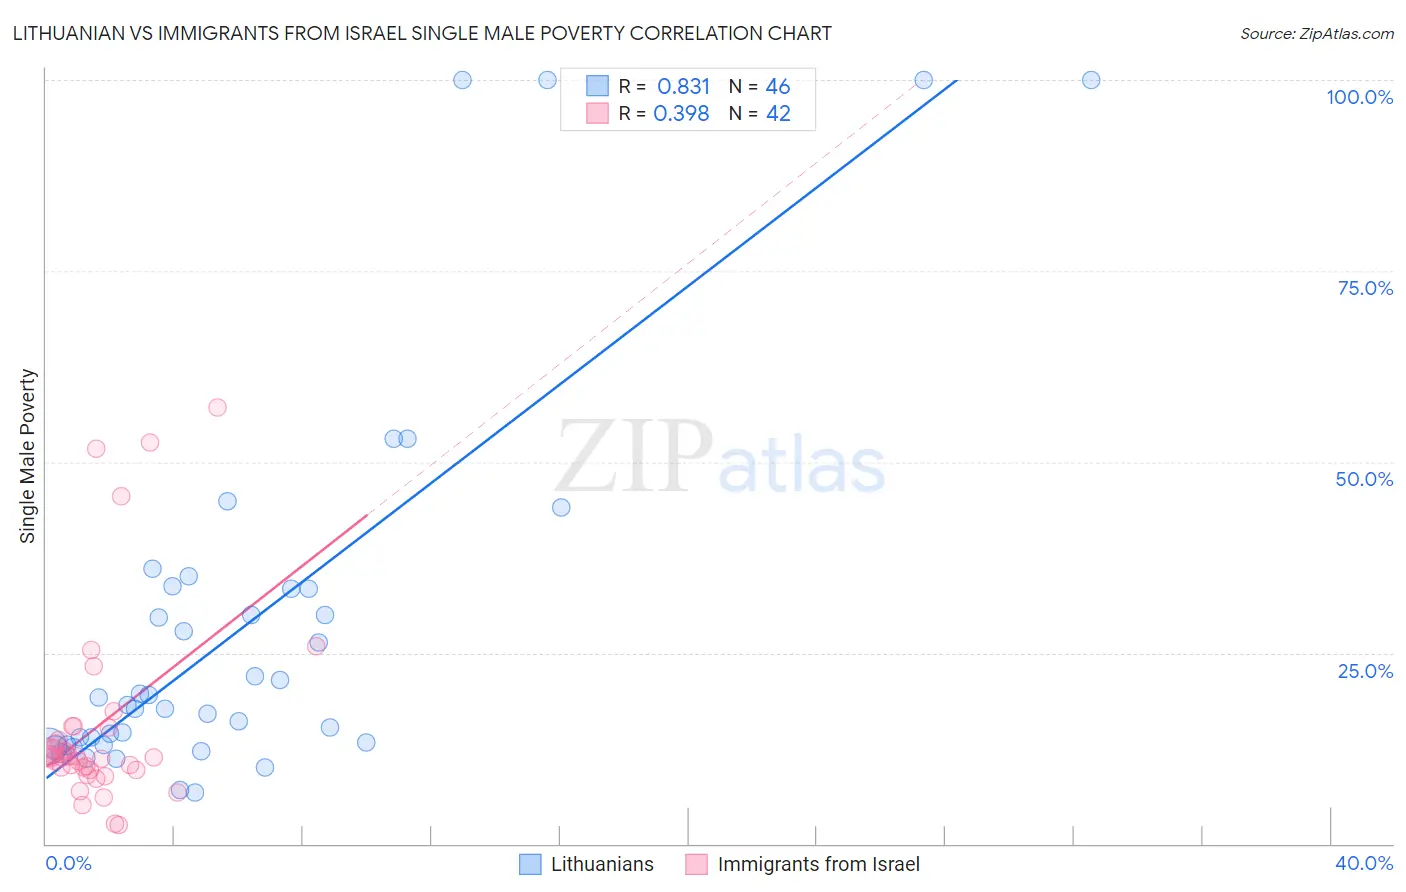
Lithuanian vs Immigrants from Israel Single Male Poverty Correlation Chart
The statistical analysis conducted on geographies consisting of 363,241,212 people shows a very strong positive correlation between the proportion of Lithuanians and poverty level among single males in the United States with a correlation coefficient (R) of 0.831 and weighted average of 13.0%. Similarly, the statistical analysis conducted on geographies consisting of 190,801,903 people shows a mild positive correlation between the proportion of Immigrants from Israel and poverty level among single males in the United States with a correlation coefficient (R) of 0.398 and weighted average of 12.1%, a difference of 7.6%.
Single Male Poverty Correlation Summary
| Measurement | Lithuanian | Immigrants from Israel |
| Minimum | 6.7% | 2.4% |
| Maximum | 100.0% | 57.1% |
| Range | 93.3% | 54.7% |
| Mean | 28.6% | 15.4% |
| Median | 18.7% | 11.3% |
| Interquartile 25% (IQ1) | 12.9% | 9.7% |
| Interquartile 75% (IQ3) | 33.3% | 15.3% |
| Interquartile Range (IQR) | 20.5% | 5.6% |
| Standard Deviation (Sample) | 25.0% | 12.9% |
| Standard Deviation (Population) | 24.8% | 12.8% |
Similar Demographics by Single Male Poverty
Demographics Similar to Lithuanians by Single Male Poverty
In terms of single male poverty, the demographic groups most similar to Lithuanians are Immigrants from Norway (13.0%, a difference of 0.020%), Slovene (13.0%, a difference of 0.040%), Trinidadian and Tobagonian (13.0%, a difference of 0.050%), Immigrants from Laos (13.0%, a difference of 0.070%), and Immigrants from Grenada (13.0%, a difference of 0.080%).
| Demographics | Rating | Rank | Single Male Poverty |
| Immigrants | Thailand | 26.6 /100 | #191 | Fair 13.0% |
| Immigrants | Jamaica | 26.5 /100 | #192 | Fair 13.0% |
| Immigrants | South Africa | 26.1 /100 | #193 | Fair 13.0% |
| Liberians | 25.2 /100 | #194 | Fair 13.0% |
| Immigrants | England | 23.4 /100 | #195 | Fair 13.0% |
| Immigrants | Grenada | 23.1 /100 | #196 | Fair 13.0% |
| Immigrants | Laos | 23.1 /100 | #197 | Fair 13.0% |
| Lithuanians | 22.1 /100 | #198 | Fair 13.0% |
| Immigrants | Norway | 21.8 /100 | #199 | Fair 13.0% |
| Slovenes | 21.6 /100 | #200 | Fair 13.0% |
| Trinidadians and Tobagonians | 21.4 /100 | #201 | Fair 13.0% |
| Basques | 20.7 /100 | #202 | Fair 13.0% |
| Immigrants | Bangladesh | 20.4 /100 | #203 | Fair 13.0% |
| Estonians | 20.3 /100 | #204 | Fair 13.0% |
| Poles | 19.3 /100 | #205 | Poor 13.0% |
Demographics Similar to Immigrants from Israel by Single Male Poverty
In terms of single male poverty, the demographic groups most similar to Immigrants from Israel are South American (12.1%, a difference of 0.010%), Turkish (12.1%, a difference of 0.020%), Immigrants from Eritrea (12.1%, a difference of 0.020%), Immigrants from Czechoslovakia (12.1%, a difference of 0.090%), and Immigrants from Colombia (12.1%, a difference of 0.12%).
| Demographics | Rating | Rank | Single Male Poverty |
| Immigrants | Belgium | 99.0 /100 | #79 | Exceptional 12.0% |
| Armenians | 98.7 /100 | #80 | Exceptional 12.1% |
| Immigrants | South America | 98.7 /100 | #81 | Exceptional 12.1% |
| Immigrants | Colombia | 98.6 /100 | #82 | Exceptional 12.1% |
| Immigrants | Chile | 98.6 /100 | #83 | Exceptional 12.1% |
| Immigrants | Czechoslovakia | 98.6 /100 | #84 | Exceptional 12.1% |
| Turks | 98.5 /100 | #85 | Exceptional 12.1% |
| Immigrants | Israel | 98.5 /100 | #86 | Exceptional 12.1% |
| South Americans | 98.5 /100 | #87 | Exceptional 12.1% |
| Immigrants | Eritrea | 98.5 /100 | #88 | Exceptional 12.1% |
| Immigrants | Ireland | 98.3 /100 | #89 | Exceptional 12.1% |
| South American Indians | 98.3 /100 | #90 | Exceptional 12.1% |
| Immigrants | Turkey | 98.2 /100 | #91 | Exceptional 12.1% |
| Spanish American Indians | 98.0 /100 | #92 | Exceptional 12.1% |
| Immigrants | Bosnia and Herzegovina | 97.9 /100 | #93 | Exceptional 12.1% |