Immigrants from Honduras vs Immigrants from Israel Single Male Poverty

COMPARE

Immigrants from Honduras
Race
Ancestry
AfghanAfricanAlaska NativeAlaskan AthabascanAlbanianAleutAlsatianAmericanApacheArabArapahoArgentineanArmenianAssyrian/Chaldean/SyriacAustralianAustrianBahamianBangladeshiBarbadianBasqueBelgianBelizeanBermudanBhutaneseBlackfeetBolivianBrazilianBritishBritish West IndianBulgarianBurmeseCajunCambodianCanadianCape VerdeanCarpatho RusynCelticCentral AmericanCentral American IndianCherokeeCheyenneChickasawChileanChineseChippewaChoctawColombianColvilleComancheCosta RicanCreeCreekCroatianCrowCubanCypriotCzechCzechoslovakianDanishDelawareDominicanDutchDutch West IndianEastern EuropeanEcuadorianEgyptianEnglishEstonianEthiopianEuropeanFijianFilipinoFinnishFrenchFrench American IndianFrench CanadianGermanGerman RussianGhanaianGreekGuamanian/ChamorroGuatemalanGuyaneseHaitianHmongHonduranHopiHoumaHungarianIcelanderIndian (Asian)IndonesianInupiatIranianIraqiIrishIroquoisIsraeliItalianJamaicanJapaneseJordanianKenyanKiowaKoreanLaotianLatvianLebaneseLiberianLithuanianLumbeeLuxembourgerMacedonianMalaysianMalteseMarshalleseMenomineeMexicanMexican American IndianMongolianMoroccanNative HawaiianNavajoNepaleseNew ZealanderNicaraguanNigerianNorthern EuropeanNorwegianOkinawanOsageOttawaPaiutePakistaniPalestinianPanamanianParaguayanPennsylvania GermanPeruvianPimaPolishPortuguesePotawatomiPuebloPuerto RicanPuget Sound SalishRomanianRussianSalvadoranSamoanScandinavianScotch-IrishScottishSeminoleSenegaleseSerbianShoshoneSierra LeoneanSiouxSlavicSlovakSloveneSomaliSouth AfricanSouth AmericanSouth American IndianSoviet UnionSpaniardSpanishSpanish AmericanSpanish American IndianSri LankanSubsaharan AfricanSudaneseSwedishSwissSyrianTaiwaneseThaiTlingit-HaidaTohono O'OdhamTonganTrinidadian and TobagonianTsimshianTurkishU.S. Virgin IslanderUgandanUkrainianUruguayanUteVenezuelanVietnameseWelshWest IndianYakamaYaquiYugoslavianYumanYup'ikZimbabwean
Immigration
NonimmigrantsImmigrantsAfghanistanAfricaAlbaniaArgentinaArmeniaAsiaAustraliaAustriaBahamasBangladeshBarbadosBelarusBelgiumBelizeBoliviaBosnia and HerzegovinaBrazilBulgariaBurma/MyanmarCabo VerdeCambodiaCameroonCanadaCaribbeanCentral AmericaChileChinaColombiaCongoCosta RicaCroatiaCubaCzechoslovakiaDenmarkDominicaDominican RepublicEastern AfricaEastern AsiaEastern EuropeEcuadorEgyptEl SalvadorEnglandEritreaEthiopiaEuropeFijiFranceGermanyGhanaGreeceGrenadaGuatemalaGuyanaHaitiHondurasHong KongHungaryIndiaIndonesiaIranIraqIrelandItalyJamaicaJapanJordanKazakhstanKenyaKoreaKuwaitLaosLatin AmericaLatviaLebanonLiberiaLithuaniaMalaysiaMexicoMicronesiaMiddle AfricaMoldovaMoroccoNepalNetherlandsNicaraguaNigeriaNorth AmericaNorth MacedoniaNorthern AfricaNorthern EuropeNorwayOceaniaPakistanPanamaPeruPhilippinesPolandPortugalRomaniaRussiaSaudi ArabiaScotlandSenegalSerbiaSierra LeoneSingaporeSomaliaSouth AfricaSouth AmericaSouth Central AsiaSouth Eastern AsiaSouthern EuropeSpainSri LankaSt. Vincent and the GrenadinesSudanSwedenSwitzerlandSyriaTaiwanThailandTrinidad and TobagoTurkeyUgandaUkraineUruguayUzbekistanVenezuelaVietnamWest IndiesWestern AfricaWestern AsiaWestern EuropeYemenZaireZimbabweAzores
Immigrants from Israel
Race
Ancestry
AfghanAfricanAlaska NativeAlaskan AthabascanAlbanianAleutAlsatianAmericanApacheArabArapahoArgentineanArmenianAssyrian/Chaldean/SyriacAustralianAustrianBahamianBangladeshiBarbadianBasqueBelgianBelizeanBermudanBhutaneseBlackfeetBolivianBrazilianBritishBritish West IndianBulgarianBurmeseCajunCambodianCanadianCape VerdeanCarpatho RusynCelticCentral AmericanCentral American IndianCherokeeCheyenneChickasawChileanChineseChippewaChoctawColombianColvilleComancheCosta RicanCreeCreekCroatianCrowCubanCypriotCzechCzechoslovakianDanishDelawareDominicanDutchDutch West IndianEastern EuropeanEcuadorianEgyptianEnglishEstonianEthiopianEuropeanFijianFilipinoFinnishFrenchFrench American IndianFrench CanadianGermanGerman RussianGhanaianGreekGuamanian/ChamorroGuatemalanGuyaneseHaitianHmongHonduranHopiHoumaHungarianIcelanderIndian (Asian)IndonesianInupiatIranianIraqiIrishIroquoisIsraeliItalianJamaicanJapaneseJordanianKenyanKiowaKoreanLaotianLatvianLebaneseLiberianLithuanianLumbeeLuxembourgerMacedonianMalaysianMalteseMarshalleseMenomineeMexicanMexican American IndianMongolianMoroccanNative HawaiianNavajoNepaleseNew ZealanderNicaraguanNigerianNorthern EuropeanNorwegianOkinawanOsageOttawaPaiutePakistaniPalestinianPanamanianParaguayanPennsylvania GermanPeruvianPimaPolishPortuguesePotawatomiPuebloPuerto RicanPuget Sound SalishRomanianRussianSalvadoranSamoanScandinavianScotch-IrishScottishSeminoleSenegaleseSerbianShoshoneSierra LeoneanSiouxSlavicSlovakSloveneSomaliSouth AfricanSouth AmericanSouth American IndianSoviet UnionSpaniardSpanishSpanish AmericanSpanish American IndianSri LankanSubsaharan AfricanSudaneseSwedishSwissSyrianTaiwaneseThaiTlingit-HaidaTohono O'OdhamTonganTrinidadian and TobagonianTsimshianTurkishU.S. Virgin IslanderUgandanUkrainianUruguayanUteVenezuelanVietnameseWelshWest IndianYakamaYaquiYugoslavianYumanYup'ikZimbabwean
Immigration
NonimmigrantsImmigrantsAfghanistanAfricaAlbaniaArgentinaArmeniaAsiaAustraliaAustriaBahamasBangladeshBarbadosBelarusBelgiumBelizeBoliviaBosnia and HerzegovinaBrazilBulgariaBurma/MyanmarCabo VerdeCambodiaCameroonCanadaCaribbeanCentral AmericaChileChinaColombiaCongoCosta RicaCroatiaCubaCzechoslovakiaDenmarkDominicaDominican RepublicEastern AfricaEastern AsiaEastern EuropeEcuadorEgyptEl SalvadorEnglandEritreaEthiopiaEuropeFijiFranceGermanyGhanaGreeceGrenadaGuatemalaGuyanaHaitiHong KongHungaryIndiaIndonesiaIranIraqIrelandIsraelItalyJamaicaJapanJordanKazakhstanKenyaKoreaKuwaitLaosLatin AmericaLatviaLebanonLiberiaLithuaniaMalaysiaMexicoMicronesiaMiddle AfricaMoldovaMoroccoNepalNetherlandsNicaraguaNigeriaNorth AmericaNorth MacedoniaNorthern AfricaNorthern EuropeNorwayOceaniaPakistanPanamaPeruPhilippinesPolandPortugalRomaniaRussiaSaudi ArabiaScotlandSenegalSerbiaSierra LeoneSingaporeSomaliaSouth AfricaSouth AmericaSouth Central AsiaSouth Eastern AsiaSouthern EuropeSpainSri LankaSt. Vincent and the GrenadinesSudanSwedenSwitzerlandSyriaTaiwanThailandTrinidad and TobagoTurkeyUgandaUkraineUruguayUzbekistanVenezuelaVietnamWest IndiesWestern AfricaWestern AsiaWestern EuropeYemenZaireZimbabweAzores
Single Male Poverty
Income
Poverty
Unemployment
Labor Participation
Family Structure
Vehicle Availability
Education Level
Disability

Single Male Poverty Comparison

Immigrants from Honduras

Immigrants from Israel

Tragic
Exceptional
14.1%
SINGLE MALE POVERTY
0.0/ 100
METRIC RATING
277th/ 347
METRIC RANK
12.1%
SINGLE MALE POVERTY
98.5/ 100
METRIC RATING
86th/ 347
METRIC RANK

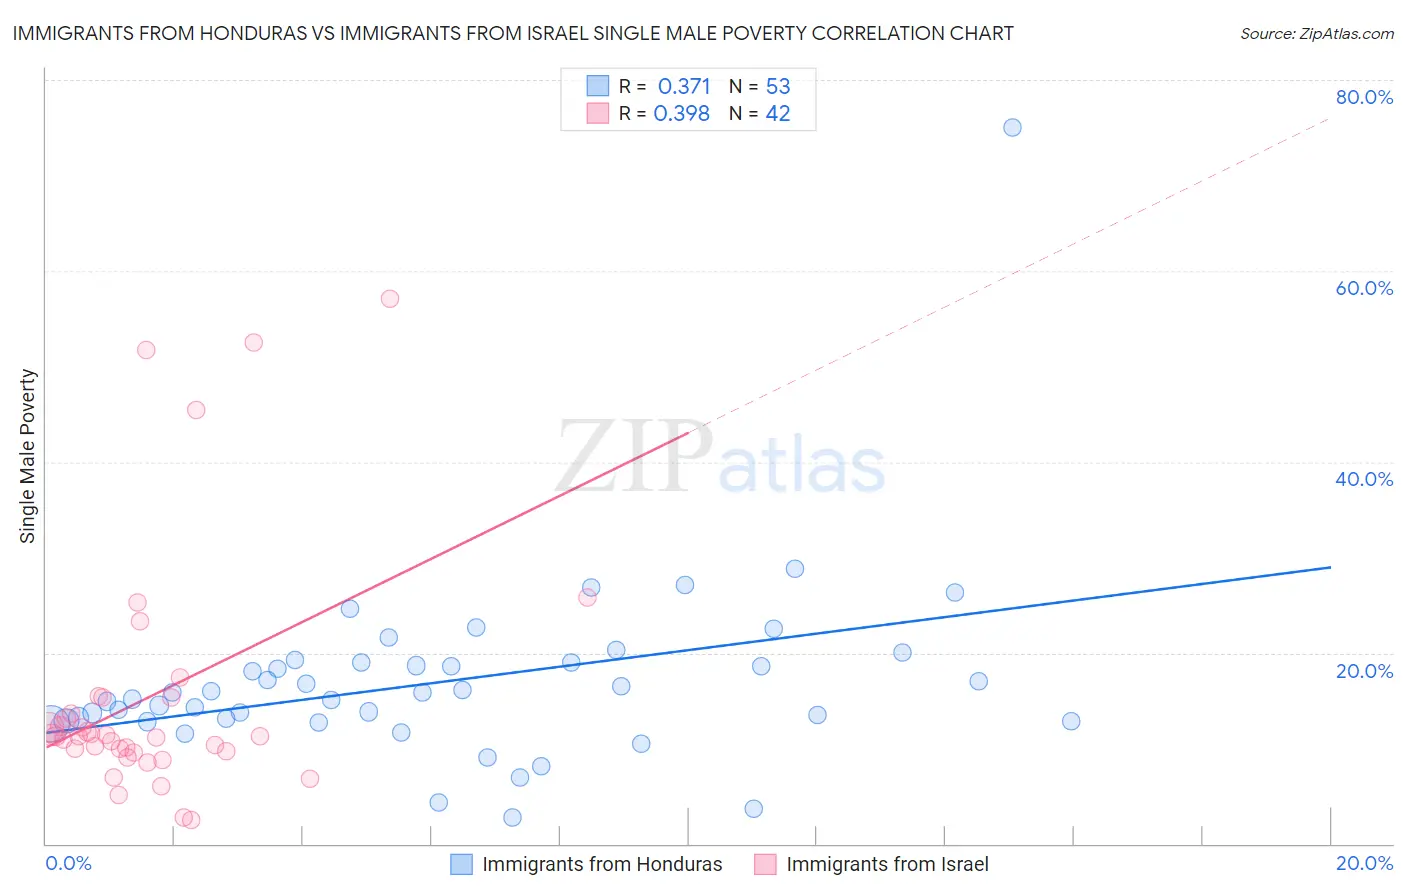
Immigrants from Honduras vs Immigrants from Israel Single Male Poverty Correlation Chart

The statistical analysis conducted on geographies consisting of 297,868,634 people shows a mild positive correlation between the proportion of Immigrants from Honduras and poverty level among single males in the United States with a correlation coefficient (R) of 0.371 and weighted average of 14.1%. Similarly, the statistical analysis conducted on geographies consisting of 190,801,903 people shows a mild positive correlation between the proportion of Immigrants from Israel and poverty level among single males in the United States with a correlation coefficient (R) of 0.398 and weighted average of 12.1%, a difference of 16.4%.
Immigrants from Honduras vs Immigrants from Israel Single Male Poverty

Single Male Poverty Correlation Summary

MeasurementImmigrants from HondurasImmigrants from Israel
Minimum2.8%2.4%
Maximum75.0%57.1%
Range72.2%54.7%
Mean16.9%15.4%
Median15.8%11.3%
Interquartile 25% (IQ1)12.8%9.7%
Interquartile 75% (IQ3)19.0%15.3%
Interquartile Range (IQR)6.2%5.6%
Standard Deviation (Sample)9.9%12.9%
Standard Deviation (Population)9.8%12.8%

Similar Demographics by Single Male Poverty

Demographics Similar to Immigrants from Honduras by Single Male Poverty

In terms of single male poverty, the demographic groups most similar to Immigrants from Honduras are Dutch (14.1%, a difference of 0.040%), Slovak (14.1%, a difference of 0.060%), Indonesian (14.1%, a difference of 0.10%), English (14.1%, a difference of 0.16%), and Honduran (14.0%, a difference of 0.23%).
DemographicsRating | RankSingle Male Poverty
Immigrants | Saudi Arabia
0.1
/100
|
#270
Tragic
14.0%
Irish
0.1
/100
|
#271
Tragic
14.0%
Mexicans
0.1
/100
|
#272
Tragic
14.0%
Welsh
0.1
/100
|
#273
Tragic
14.0%
Hondurans
0.1
/100
|
#274
Tragic
14.0%
English
0.1
/100
|
#275
Tragic
14.1%
Dutch
0.1
/100
|
#276
Tragic
14.1%
Immigrants | Honduras
0.0
/100
|
#277
Tragic
14.1%
Slovaks
0.0
/100
|
#278
Tragic
14.1%
Indonesians
0.0
/100
|
#279
Tragic
14.1%
Hmong
0.0
/100
|
#280
Tragic
14.2%
Hispanics or Latinos
0.0
/100
|
#281
Tragic
14.2%
Spanish Americans
0.0
/100
|
#282
Tragic
14.2%
Yaqui
0.0
/100
|
#283
Tragic
14.2%
Immigrants | Bahamas
0.0
/100
|
#284
Tragic
14.4%

Demographics Similar to Immigrants from Israel by Single Male Poverty

In terms of single male poverty, the demographic groups most similar to Immigrants from Israel are South American (12.1%, a difference of 0.010%), Turkish (12.1%, a difference of 0.020%), Immigrants from Eritrea (12.1%, a difference of 0.020%), Immigrants from Czechoslovakia (12.1%, a difference of 0.090%), and Immigrants from Colombia (12.1%, a difference of 0.12%).
DemographicsRating | RankSingle Male Poverty
Immigrants | Belgium
99.0
/100
|
#79
Exceptional
12.0%
Armenians
98.7
/100
|
#80
Exceptional
12.1%
Immigrants | South America
98.7
/100
|
#81
Exceptional
12.1%
Immigrants | Colombia
98.6
/100
|
#82
Exceptional
12.1%
Immigrants | Chile
98.6
/100
|
#83
Exceptional
12.1%
Immigrants | Czechoslovakia
98.6
/100
|
#84
Exceptional
12.1%
Turks
98.5
/100
|
#85
Exceptional
12.1%
Immigrants | Israel
98.5
/100
|
#86
Exceptional
12.1%
South Americans
98.5
/100
|
#87
Exceptional
12.1%
Immigrants | Eritrea
98.5
/100
|
#88
Exceptional
12.1%
Immigrants | Ireland
98.3
/100
|
#89
Exceptional
12.1%
South American Indians
98.3
/100
|
#90
Exceptional
12.1%
Immigrants | Turkey
98.2
/100
|
#91
Exceptional
12.1%
Spanish American Indians
98.0
/100
|
#92
Exceptional
12.1%
Immigrants | Bosnia and Herzegovina
97.9
/100
|
#93
Exceptional
12.1%