Seminole vs Immigrants from Saudi Arabia Single Male Poverty
COMPARE
Seminole
Immigrants from Saudi Arabia
Single Male Poverty
Single Male Poverty Comparison
Seminole
Immigrants from Saudi Arabia
16.0%
SINGLE MALE POVERTY
0.0/ 100
METRIC RATING
311th/ 347
METRIC RANK
14.0%
SINGLE MALE POVERTY
0.1/ 100
METRIC RATING
270th/ 347
METRIC RANK
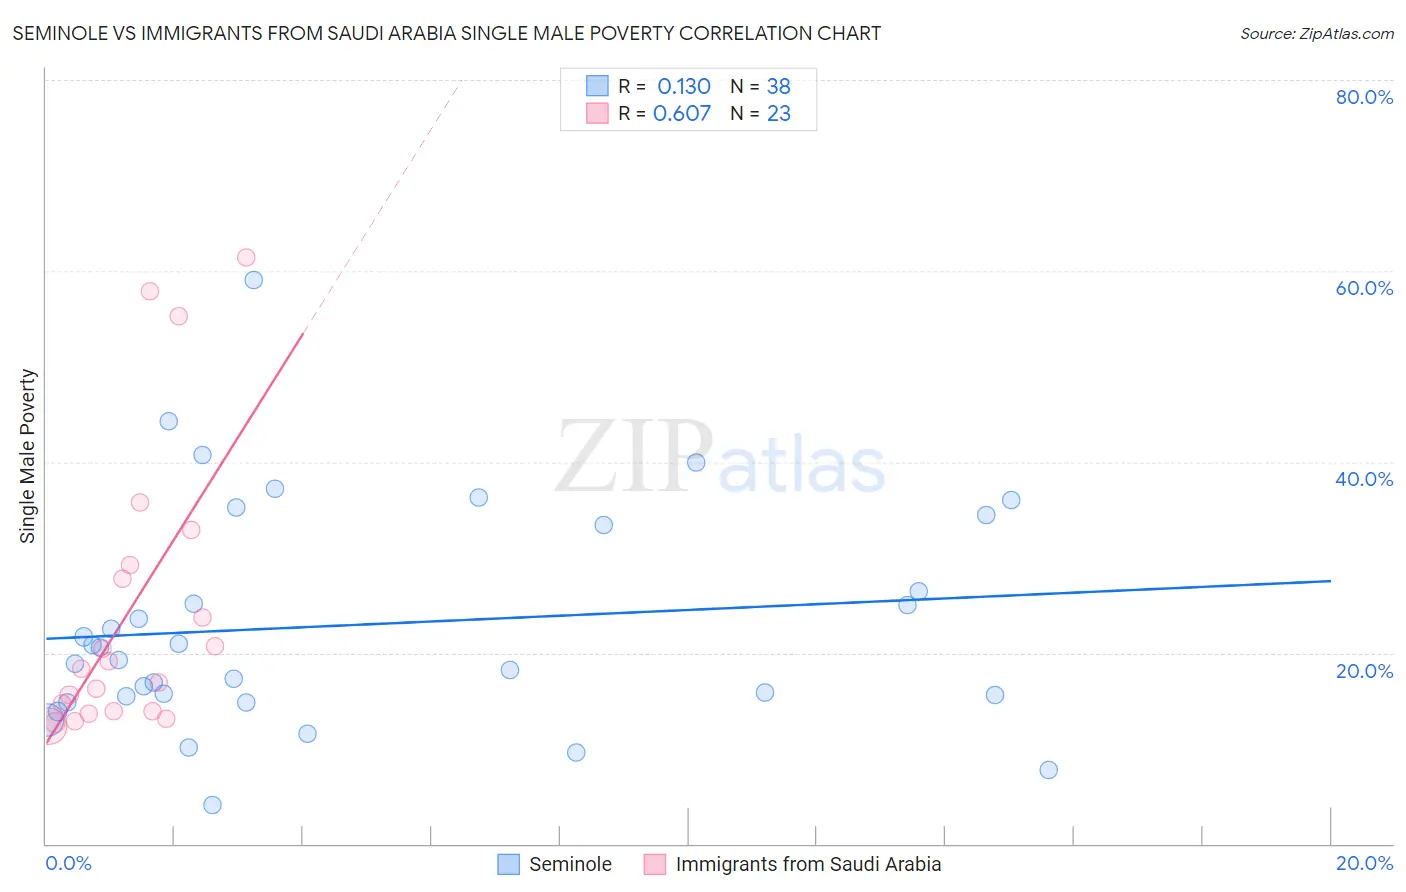
Seminole vs Immigrants from Saudi Arabia Single Male Poverty Correlation Chart
The statistical analysis conducted on geographies consisting of 113,333,266 people shows a poor positive correlation between the proportion of Seminole and poverty level among single males in the United States with a correlation coefficient (R) of 0.130 and weighted average of 16.0%. Similarly, the statistical analysis conducted on geographies consisting of 155,832,907 people shows a significant positive correlation between the proportion of Immigrants from Saudi Arabia and poverty level among single males in the United States with a correlation coefficient (R) of 0.607 and weighted average of 14.0%, a difference of 14.7%.
Single Male Poverty Correlation Summary
| Measurement | Seminole | Immigrants from Saudi Arabia |
| Minimum | 4.0% | 12.2% |
| Maximum | 59.1% | 61.3% |
| Range | 55.1% | 49.1% |
| Mean | 22.9% | 24.3% |
| Median | 19.9% | 18.3% |
| Interquartile 25% (IQ1) | 15.5% | 13.9% |
| Interquartile 75% (IQ3) | 33.3% | 29.1% |
| Interquartile Range (IQR) | 17.9% | 15.3% |
| Standard Deviation (Sample) | 11.7% | 15.0% |
| Standard Deviation (Population) | 11.6% | 14.7% |
Similar Demographics by Single Male Poverty
Demographics Similar to Seminole by Single Male Poverty
In terms of single male poverty, the demographic groups most similar to Seminole are Comanche (16.0%, a difference of 0.0%), Cherokee (16.1%, a difference of 0.23%), Alaskan Athabascan (16.1%, a difference of 0.52%), Yakama (15.9%, a difference of 0.54%), and Cheyenne (16.1%, a difference of 0.57%).
| Demographics | Rating | Rank | Single Male Poverty |
| Alaska Natives | 0.0 /100 | #304 | Tragic 15.4% |
| Blackfeet | 0.0 /100 | #305 | Tragic 15.5% |
| Pennsylvania Germans | 0.0 /100 | #306 | Tragic 15.6% |
| Ute | 0.0 /100 | #307 | Tragic 15.7% |
| Potawatomi | 0.0 /100 | #308 | Tragic 15.8% |
| Americans | 0.0 /100 | #309 | Tragic 15.8% |
| Yakama | 0.0 /100 | #310 | Tragic 15.9% |
| Seminole | 0.0 /100 | #311 | Tragic 16.0% |
| Comanche | 0.0 /100 | #312 | Tragic 16.0% |
| Cherokee | 0.0 /100 | #313 | Tragic 16.1% |
| Alaskan Athabascans | 0.0 /100 | #314 | Tragic 16.1% |
| Cheyenne | 0.0 /100 | #315 | Tragic 16.1% |
| Dutch West Indians | 0.0 /100 | #316 | Tragic 16.1% |
| Blacks/African Americans | 0.0 /100 | #317 | Tragic 16.2% |
| Chickasaw | 0.0 /100 | #318 | Tragic 16.3% |
Demographics Similar to Immigrants from Saudi Arabia by Single Male Poverty
In terms of single male poverty, the demographic groups most similar to Immigrants from Saudi Arabia are Scottish (14.0%, a difference of 0.010%), Irish (14.0%, a difference of 0.030%), Mexican (14.0%, a difference of 0.090%), Immigrants from Mexico (13.9%, a difference of 0.17%), and German (13.9%, a difference of 0.23%).
| Demographics | Rating | Rank | Single Male Poverty |
| Cape Verdeans | 0.2 /100 | #263 | Tragic 13.8% |
| West Indians | 0.2 /100 | #264 | Tragic 13.8% |
| Immigrants | Congo | 0.2 /100 | #265 | Tragic 13.9% |
| Immigrants | Cabo Verde | 0.1 /100 | #266 | Tragic 13.9% |
| Germans | 0.1 /100 | #267 | Tragic 13.9% |
| Immigrants | Mexico | 0.1 /100 | #268 | Tragic 13.9% |
| Scottish | 0.1 /100 | #269 | Tragic 14.0% |
| Immigrants | Saudi Arabia | 0.1 /100 | #270 | Tragic 14.0% |
| Irish | 0.1 /100 | #271 | Tragic 14.0% |
| Mexicans | 0.1 /100 | #272 | Tragic 14.0% |
| Welsh | 0.1 /100 | #273 | Tragic 14.0% |
| Hondurans | 0.1 /100 | #274 | Tragic 14.0% |
| English | 0.1 /100 | #275 | Tragic 14.1% |
| Dutch | 0.1 /100 | #276 | Tragic 14.1% |
| Immigrants | Honduras | 0.0 /100 | #277 | Tragic 14.1% |