Yaqui vs Immigrants from Israel Single Male Poverty
COMPARE
Yaqui
Immigrants from Israel
Single Male Poverty
Single Male Poverty Comparison
Yaqui
Immigrants from Israel
14.2%
SINGLE MALE POVERTY
0.0/ 100
METRIC RATING
283rd/ 347
METRIC RANK
12.1%
SINGLE MALE POVERTY
98.5/ 100
METRIC RATING
86th/ 347
METRIC RANK
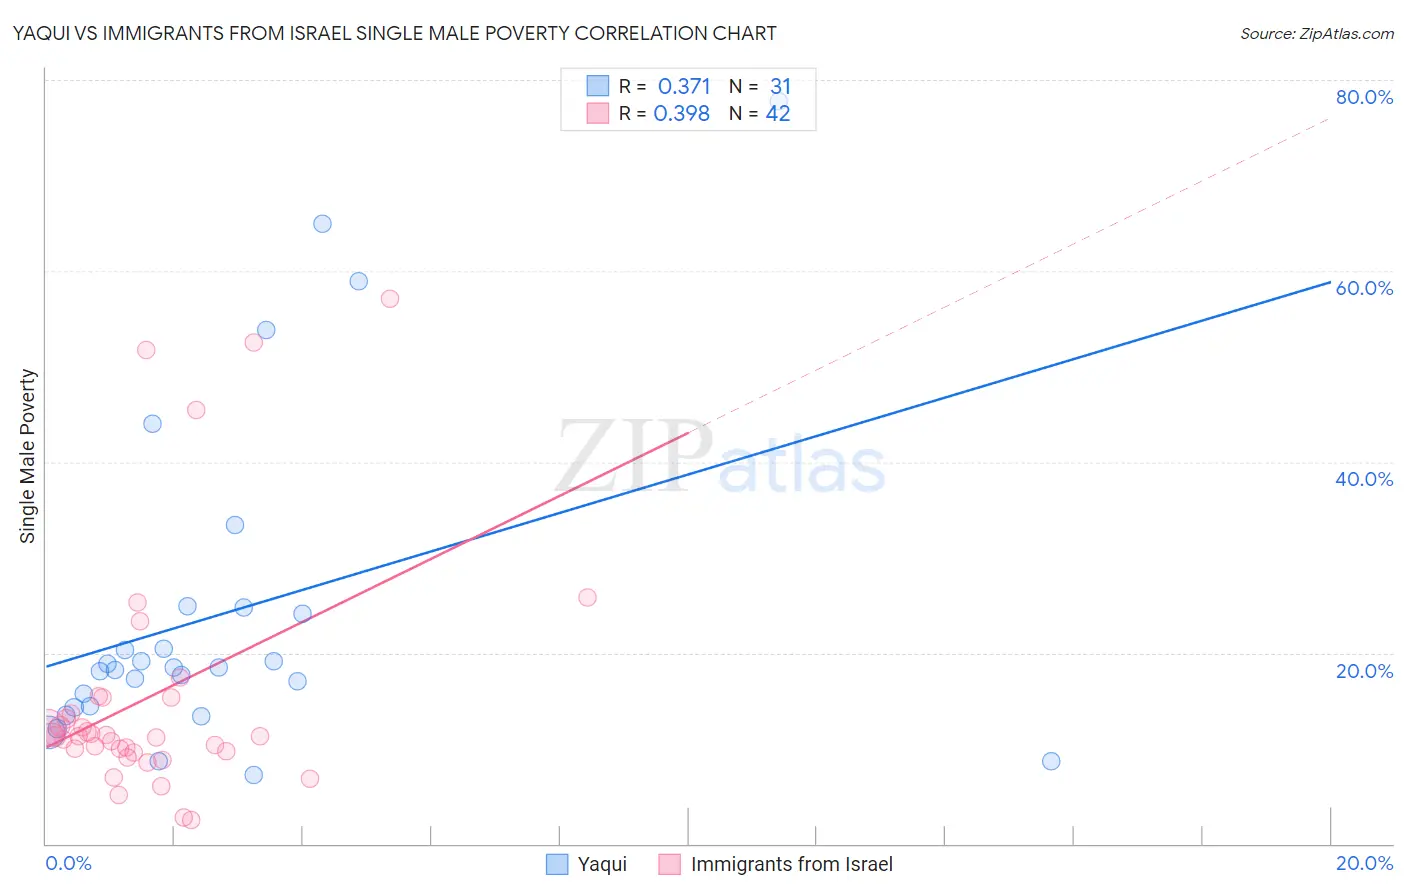
Yaqui vs Immigrants from Israel Single Male Poverty Correlation Chart
The statistical analysis conducted on geographies consisting of 103,533,102 people shows a mild positive correlation between the proportion of Yaqui and poverty level among single males in the United States with a correlation coefficient (R) of 0.371 and weighted average of 14.2%. Similarly, the statistical analysis conducted on geographies consisting of 190,801,903 people shows a mild positive correlation between the proportion of Immigrants from Israel and poverty level among single males in the United States with a correlation coefficient (R) of 0.398 and weighted average of 12.1%, a difference of 17.8%.
Single Male Poverty Correlation Summary
| Measurement | Yaqui | Immigrants from Israel |
| Minimum | 7.2% | 2.4% |
| Maximum | 77.8% | 57.1% |
| Range | 70.6% | 54.7% |
| Mean | 24.1% | 15.4% |
| Median | 18.4% | 11.3% |
| Interquartile 25% (IQ1) | 14.2% | 9.7% |
| Interquartile 75% (IQ3) | 24.8% | 15.3% |
| Interquartile Range (IQR) | 10.5% | 5.6% |
| Standard Deviation (Sample) | 17.4% | 12.9% |
| Standard Deviation (Population) | 17.1% | 12.8% |
Similar Demographics by Single Male Poverty
Demographics Similar to Yaqui by Single Male Poverty
In terms of single male poverty, the demographic groups most similar to Yaqui are Spanish American (14.2%, a difference of 0.16%), Hispanic or Latino (14.2%, a difference of 0.32%), Hmong (14.2%, a difference of 0.34%), Indonesian (14.1%, a difference of 1.1%), and Slovak (14.1%, a difference of 1.1%).
| Demographics | Rating | Rank | Single Male Poverty |
| Dutch | 0.1 /100 | #276 | Tragic 14.1% |
| Immigrants | Honduras | 0.0 /100 | #277 | Tragic 14.1% |
| Slovaks | 0.0 /100 | #278 | Tragic 14.1% |
| Indonesians | 0.0 /100 | #279 | Tragic 14.1% |
| Hmong | 0.0 /100 | #280 | Tragic 14.2% |
| Hispanics or Latinos | 0.0 /100 | #281 | Tragic 14.2% |
| Spanish Americans | 0.0 /100 | #282 | Tragic 14.2% |
| Yaqui | 0.0 /100 | #283 | Tragic 14.2% |
| Immigrants | Bahamas | 0.0 /100 | #284 | Tragic 14.4% |
| French | 0.0 /100 | #285 | Tragic 14.4% |
| Celtics | 0.0 /100 | #286 | Tragic 14.5% |
| Iroquois | 0.0 /100 | #287 | Tragic 14.5% |
| Whites/Caucasians | 0.0 /100 | #288 | Tragic 14.5% |
| Immigrants | Dominica | 0.0 /100 | #289 | Tragic 14.5% |
| U.S. Virgin Islanders | 0.0 /100 | #290 | Tragic 14.5% |
Demographics Similar to Immigrants from Israel by Single Male Poverty
In terms of single male poverty, the demographic groups most similar to Immigrants from Israel are South American (12.1%, a difference of 0.010%), Turkish (12.1%, a difference of 0.020%), Immigrants from Eritrea (12.1%, a difference of 0.020%), Immigrants from Czechoslovakia (12.1%, a difference of 0.090%), and Immigrants from Colombia (12.1%, a difference of 0.12%).
| Demographics | Rating | Rank | Single Male Poverty |
| Immigrants | Belgium | 99.0 /100 | #79 | Exceptional 12.0% |
| Armenians | 98.7 /100 | #80 | Exceptional 12.1% |
| Immigrants | South America | 98.7 /100 | #81 | Exceptional 12.1% |
| Immigrants | Colombia | 98.6 /100 | #82 | Exceptional 12.1% |
| Immigrants | Chile | 98.6 /100 | #83 | Exceptional 12.1% |
| Immigrants | Czechoslovakia | 98.6 /100 | #84 | Exceptional 12.1% |
| Turks | 98.5 /100 | #85 | Exceptional 12.1% |
| Immigrants | Israel | 98.5 /100 | #86 | Exceptional 12.1% |
| South Americans | 98.5 /100 | #87 | Exceptional 12.1% |
| Immigrants | Eritrea | 98.5 /100 | #88 | Exceptional 12.1% |
| Immigrants | Ireland | 98.3 /100 | #89 | Exceptional 12.1% |
| South American Indians | 98.3 /100 | #90 | Exceptional 12.1% |
| Immigrants | Turkey | 98.2 /100 | #91 | Exceptional 12.1% |
| Spanish American Indians | 98.0 /100 | #92 | Exceptional 12.1% |
| Immigrants | Bosnia and Herzegovina | 97.9 /100 | #93 | Exceptional 12.1% |