Seminole vs Immigrants from Kenya Single Male Poverty
COMPARE
Seminole
Immigrants from Kenya
Single Male Poverty
Single Male Poverty Comparison
Seminole
Immigrants from Kenya
16.0%
SINGLE MALE POVERTY
0.0/ 100
METRIC RATING
311th/ 347
METRIC RANK
12.5%
SINGLE MALE POVERTY
87.6/ 100
METRIC RATING
123rd/ 347
METRIC RANK
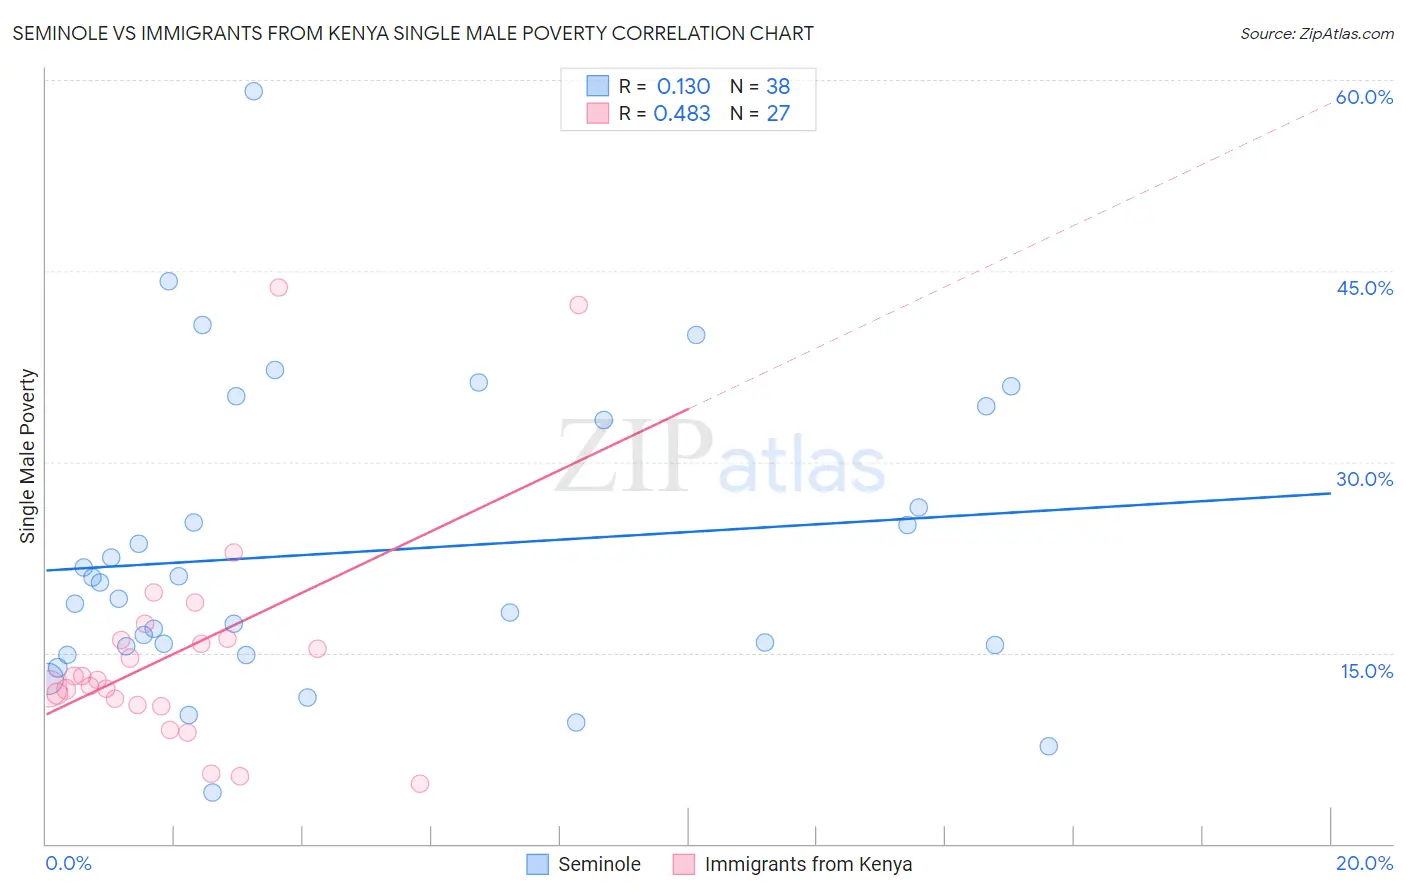
Seminole vs Immigrants from Kenya Single Male Poverty Correlation Chart
The statistical analysis conducted on geographies consisting of 113,333,266 people shows a poor positive correlation between the proportion of Seminole and poverty level among single males in the United States with a correlation coefficient (R) of 0.130 and weighted average of 16.0%. Similarly, the statistical analysis conducted on geographies consisting of 201,857,660 people shows a moderate positive correlation between the proportion of Immigrants from Kenya and poverty level among single males in the United States with a correlation coefficient (R) of 0.483 and weighted average of 12.5%, a difference of 28.5%.
Single Male Poverty Correlation Summary
| Measurement | Seminole | Immigrants from Kenya |
| Minimum | 4.0% | 4.8% |
| Maximum | 59.1% | 43.7% |
| Range | 55.1% | 38.9% |
| Mean | 22.9% | 15.1% |
| Median | 19.9% | 12.9% |
| Interquartile 25% (IQ1) | 15.5% | 10.9% |
| Interquartile 75% (IQ3) | 33.3% | 16.1% |
| Interquartile Range (IQR) | 17.9% | 5.2% |
| Standard Deviation (Sample) | 11.7% | 9.1% |
| Standard Deviation (Population) | 11.6% | 8.9% |
Similar Demographics by Single Male Poverty
Demographics Similar to Seminole by Single Male Poverty
In terms of single male poverty, the demographic groups most similar to Seminole are Comanche (16.0%, a difference of 0.0%), Cherokee (16.1%, a difference of 0.23%), Alaskan Athabascan (16.1%, a difference of 0.52%), Yakama (15.9%, a difference of 0.54%), and Cheyenne (16.1%, a difference of 0.57%).
| Demographics | Rating | Rank | Single Male Poverty |
| Alaska Natives | 0.0 /100 | #304 | Tragic 15.4% |
| Blackfeet | 0.0 /100 | #305 | Tragic 15.5% |
| Pennsylvania Germans | 0.0 /100 | #306 | Tragic 15.6% |
| Ute | 0.0 /100 | #307 | Tragic 15.7% |
| Potawatomi | 0.0 /100 | #308 | Tragic 15.8% |
| Americans | 0.0 /100 | #309 | Tragic 15.8% |
| Yakama | 0.0 /100 | #310 | Tragic 15.9% |
| Seminole | 0.0 /100 | #311 | Tragic 16.0% |
| Comanche | 0.0 /100 | #312 | Tragic 16.0% |
| Cherokee | 0.0 /100 | #313 | Tragic 16.1% |
| Alaskan Athabascans | 0.0 /100 | #314 | Tragic 16.1% |
| Cheyenne | 0.0 /100 | #315 | Tragic 16.1% |
| Dutch West Indians | 0.0 /100 | #316 | Tragic 16.1% |
| Blacks/African Americans | 0.0 /100 | #317 | Tragic 16.2% |
| Chickasaw | 0.0 /100 | #318 | Tragic 16.3% |
Demographics Similar to Immigrants from Kenya by Single Male Poverty
In terms of single male poverty, the demographic groups most similar to Immigrants from Kenya are Russian (12.5%, a difference of 0.030%), Serbian (12.5%, a difference of 0.040%), Immigrants from Jordan (12.5%, a difference of 0.060%), Icelander (12.5%, a difference of 0.090%), and Romanian (12.5%, a difference of 0.14%).
| Demographics | Rating | Rank | Single Male Poverty |
| Immigrants | Syria | 91.2 /100 | #116 | Exceptional 12.4% |
| Immigrants | Oceania | 91.1 /100 | #117 | Exceptional 12.4% |
| Albanians | 90.6 /100 | #118 | Exceptional 12.4% |
| Immigrants | Albania | 90.3 /100 | #119 | Exceptional 12.4% |
| Venezuelans | 89.4 /100 | #120 | Excellent 12.4% |
| Icelanders | 88.2 /100 | #121 | Excellent 12.5% |
| Serbians | 87.9 /100 | #122 | Excellent 12.5% |
| Immigrants | Kenya | 87.6 /100 | #123 | Excellent 12.5% |
| Russians | 87.3 /100 | #124 | Excellent 12.5% |
| Immigrants | Jordan | 87.1 /100 | #125 | Excellent 12.5% |
| Romanians | 86.4 /100 | #126 | Excellent 12.5% |
| Immigrants | Netherlands | 86.2 /100 | #127 | Excellent 12.5% |
| Ecuadorians | 85.9 /100 | #128 | Excellent 12.5% |
| Immigrants | Sierra Leone | 85.5 /100 | #129 | Excellent 12.5% |
| Immigrants | Nicaragua | 84.8 /100 | #130 | Excellent 12.5% |