Seminole vs German Median Female Earnings
COMPARE
Seminole
German
Median Female Earnings
Median Female Earnings Comparison
Seminole
Germans
$34,385
MEDIAN FEMALE EARNINGS
0.0/ 100
METRIC RATING
323rd/ 347
METRIC RANK
$37,986
MEDIAN FEMALE EARNINGS
2.8/ 100
METRIC RATING
243rd/ 347
METRIC RANK
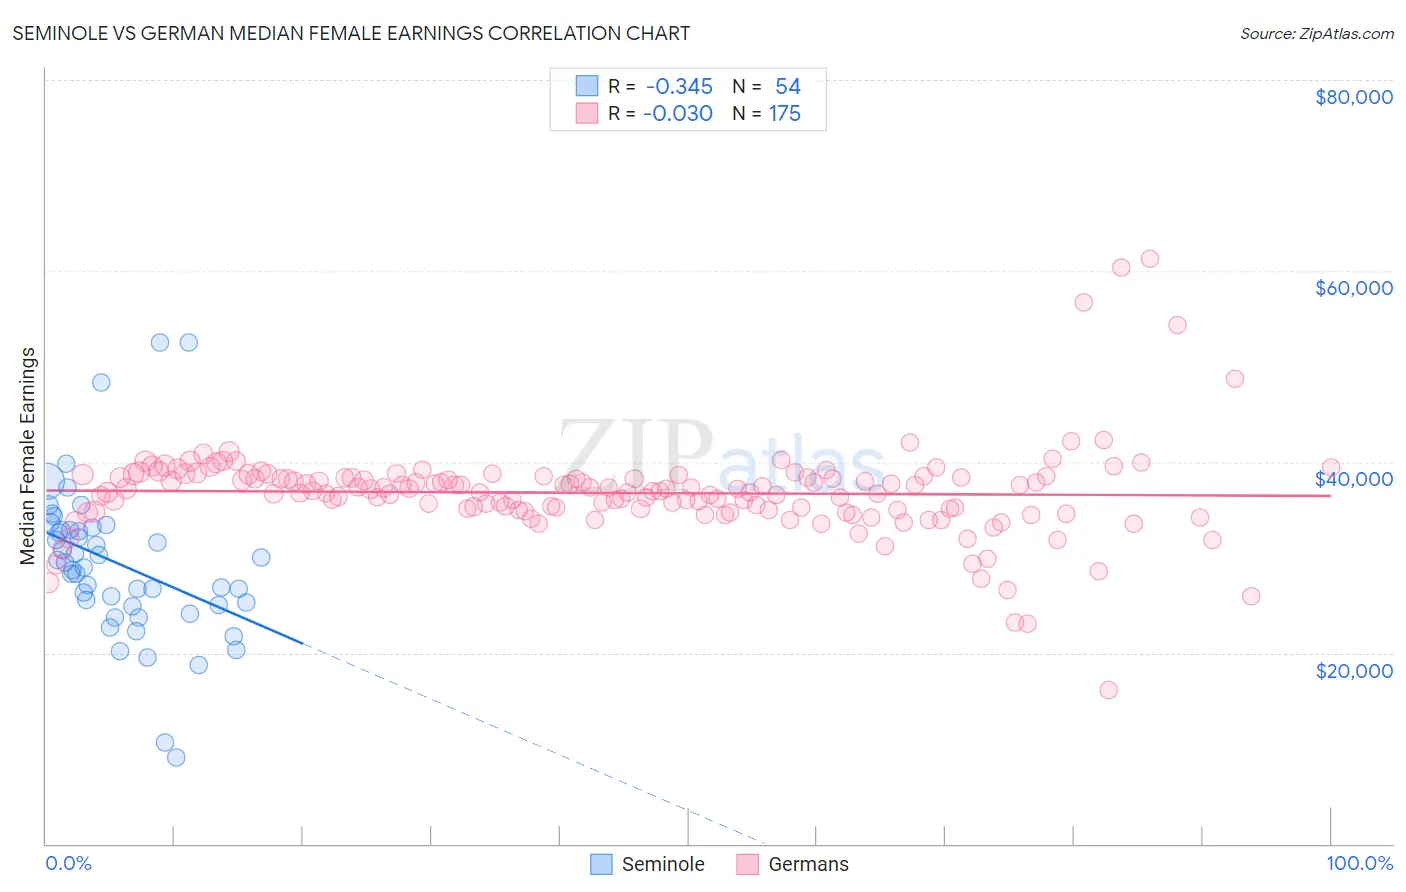
Seminole vs German Median Female Earnings Correlation Chart
The statistical analysis conducted on geographies consisting of 118,266,998 people shows a mild negative correlation between the proportion of Seminole and median female earnings in the United States with a correlation coefficient (R) of -0.345 and weighted average of $34,385. Similarly, the statistical analysis conducted on geographies consisting of 578,410,378 people shows no correlation between the proportion of Germans and median female earnings in the United States with a correlation coefficient (R) of -0.030 and weighted average of $37,986, a difference of 10.5%.
Median Female Earnings Correlation Summary
| Measurement | Seminole | German |
| Minimum | $9,041 | $16,161 |
| Maximum | $52,528 | $61,250 |
| Range | $43,487 | $45,089 |
| Mean | $29,347 | $36,748 |
| Median | $29,210 | $36,985 |
| Interquartile 25% (IQ1) | $25,000 | $34,926 |
| Interquartile 75% (IQ3) | $32,861 | $38,384 |
| Interquartile Range (IQR) | $7,861 | $3,458 |
| Standard Deviation (Sample) | $8,052 | $4,922 |
| Standard Deviation (Population) | $7,977 | $4,908 |
Similar Demographics by Median Female Earnings
Demographics Similar to Seminole by Median Female Earnings
In terms of median female earnings, the demographic groups most similar to Seminole are Chickasaw ($34,414, a difference of 0.080%), Hispanic or Latino ($34,421, a difference of 0.11%), Immigrants from Congo ($34,317, a difference of 0.20%), Immigrants from Honduras ($34,647, a difference of 0.76%), and Dutch West Indian ($34,106, a difference of 0.82%).
| Demographics | Rating | Rank | Median Female Earnings |
| Cherokee | 0.0 /100 | #316 | Tragic $34,742 |
| Potawatomi | 0.0 /100 | #317 | Tragic $34,739 |
| Immigrants | Yemen | 0.0 /100 | #318 | Tragic $34,693 |
| Shoshone | 0.0 /100 | #319 | Tragic $34,677 |
| Immigrants | Honduras | 0.0 /100 | #320 | Tragic $34,647 |
| Hispanics or Latinos | 0.0 /100 | #321 | Tragic $34,421 |
| Chickasaw | 0.0 /100 | #322 | Tragic $34,414 |
| Seminole | 0.0 /100 | #323 | Tragic $34,385 |
| Immigrants | Congo | 0.0 /100 | #324 | Tragic $34,317 |
| Dutch West Indians | 0.0 /100 | #325 | Tragic $34,106 |
| Kiowa | 0.0 /100 | #326 | Tragic $34,074 |
| Cajuns | 0.0 /100 | #327 | Tragic $34,034 |
| Immigrants | Central America | 0.0 /100 | #328 | Tragic $33,953 |
| Hopi | 0.0 /100 | #329 | Tragic $33,932 |
| Menominee | 0.0 /100 | #330 | Tragic $33,894 |
Demographics Similar to Germans by Median Female Earnings
In terms of median female earnings, the demographic groups most similar to Germans are Immigrants from Liberia ($37,970, a difference of 0.040%), Immigrants from Middle Africa ($37,965, a difference of 0.050%), Delaware ($37,964, a difference of 0.060%), Immigrants from Burma/Myanmar ($38,028, a difference of 0.11%), and Immigrants from Somalia ($37,914, a difference of 0.19%).
| Demographics | Rating | Rank | Median Female Earnings |
| Liberians | 4.4 /100 | #236 | Tragic $38,215 |
| Immigrants | Cabo Verde | 4.3 /100 | #237 | Tragic $38,208 |
| Alaska Natives | 4.3 /100 | #238 | Tragic $38,202 |
| English | 4.2 /100 | #239 | Tragic $38,196 |
| Finns | 4.0 /100 | #240 | Tragic $38,173 |
| Spanish | 3.5 /100 | #241 | Tragic $38,098 |
| Immigrants | Burma/Myanmar | 3.0 /100 | #242 | Tragic $38,028 |
| Germans | 2.8 /100 | #243 | Tragic $37,986 |
| Immigrants | Liberia | 2.7 /100 | #244 | Tragic $37,970 |
| Immigrants | Middle Africa | 2.7 /100 | #245 | Tragic $37,965 |
| Delaware | 2.6 /100 | #246 | Tragic $37,964 |
| Immigrants | Somalia | 2.4 /100 | #247 | Tragic $37,914 |
| Alaskan Athabascans | 2.3 /100 | #248 | Tragic $37,905 |
| Swiss | 2.3 /100 | #249 | Tragic $37,904 |
| Immigrants | Iraq | 2.2 /100 | #250 | Tragic $37,864 |