Seminole vs German Child Poverty Under the Age of 5
COMPARE
Seminole
German
Child Poverty Under the Age of 5
Child Poverty Under the Age of 5 Comparison
Seminole
Germans
22.8%
CHILD POVERTY UNDER THE AGE OF 5
0.0/ 100
METRIC RATING
311th/ 347
METRIC RANK
16.5%
CHILD POVERTY UNDER THE AGE OF 5
84.8/ 100
METRIC RATING
138th/ 347
METRIC RANK
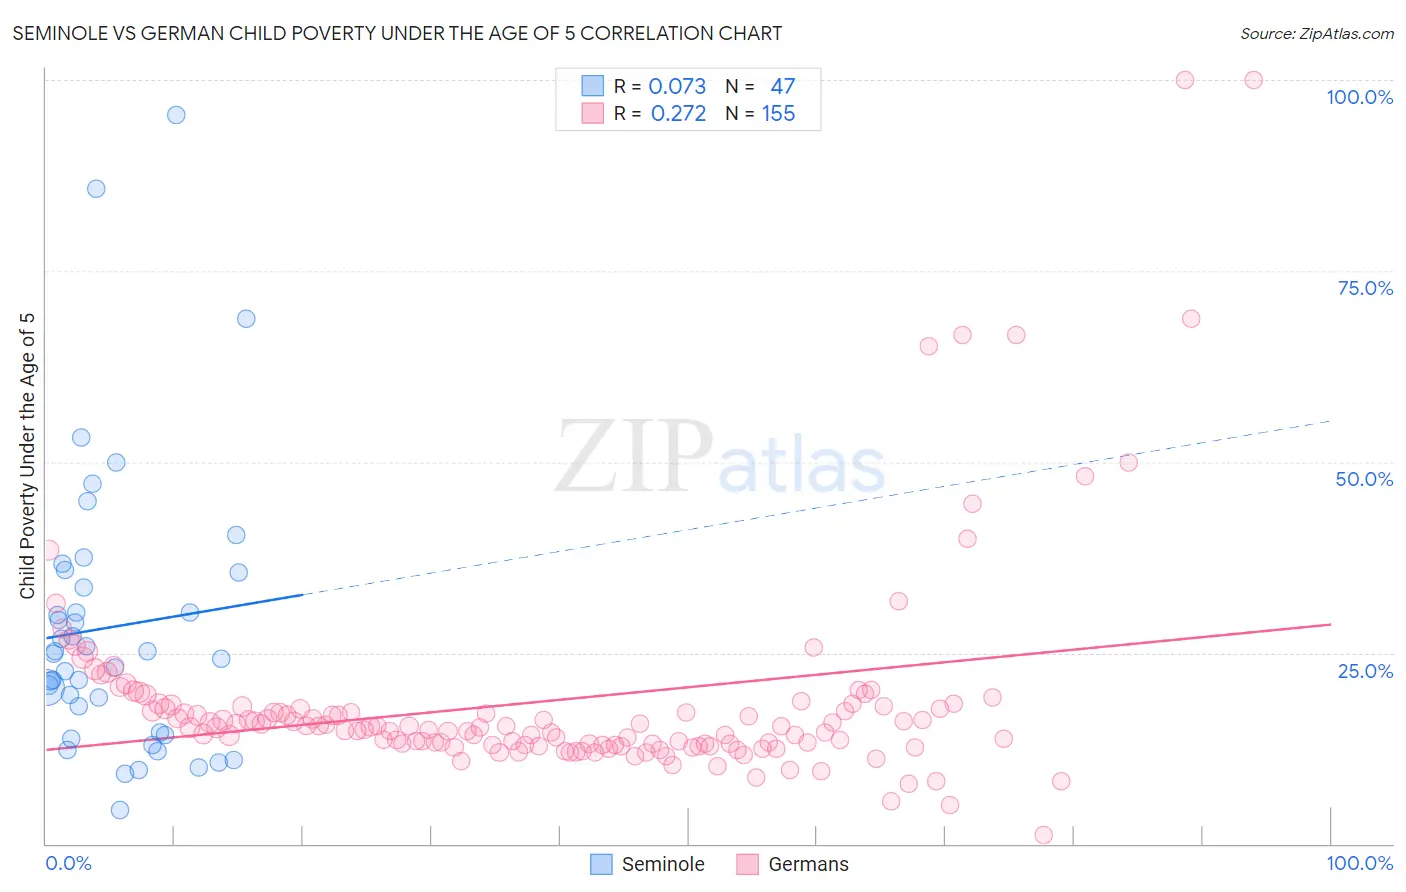
Seminole vs German Child Poverty Under the Age of 5 Correlation Chart
The statistical analysis conducted on geographies consisting of 117,328,756 people shows a slight positive correlation between the proportion of Seminole and poverty level among children under the age of 5 in the United States with a correlation coefficient (R) of 0.073 and weighted average of 22.8%. Similarly, the statistical analysis conducted on geographies consisting of 537,099,242 people shows a weak positive correlation between the proportion of Germans and poverty level among children under the age of 5 in the United States with a correlation coefficient (R) of 0.272 and weighted average of 16.5%, a difference of 38.6%.
Child Poverty Under the Age of 5 Correlation Summary
| Measurement | Seminole | German |
| Minimum | 4.3% | 1.1% |
| Maximum | 95.5% | 100.0% |
| Range | 91.1% | 98.9% |
| Mean | 28.4% | 18.7% |
| Median | 24.9% | 15.3% |
| Interquartile 25% (IQ1) | 14.6% | 13.0% |
| Interquartile 75% (IQ3) | 35.5% | 18.0% |
| Interquartile Range (IQR) | 20.9% | 5.0% |
| Standard Deviation (Sample) | 18.6% | 14.0% |
| Standard Deviation (Population) | 18.4% | 14.0% |
Similar Demographics by Child Poverty Under the Age of 5
Demographics Similar to Seminole by Child Poverty Under the Age of 5
In terms of child poverty under the age of 5, the demographic groups most similar to Seminole are African (22.8%, a difference of 0.050%), Houma (22.7%, a difference of 0.45%), Immigrants from Dominica (22.7%, a difference of 0.59%), Honduran (23.0%, a difference of 0.60%), and Immigrants from Bahamas (22.7%, a difference of 0.63%).
| Demographics | Rating | Rank | Child Poverty Under the Age of 5 |
| Immigrants | Guatemala | 0.0 /100 | #304 | Tragic 22.0% |
| Immigrants | Mexico | 0.0 /100 | #305 | Tragic 22.2% |
| Indonesians | 0.0 /100 | #306 | Tragic 22.3% |
| Immigrants | Bahamas | 0.0 /100 | #307 | Tragic 22.7% |
| Immigrants | Dominica | 0.0 /100 | #308 | Tragic 22.7% |
| Houma | 0.0 /100 | #309 | Tragic 22.7% |
| Africans | 0.0 /100 | #310 | Tragic 22.8% |
| Seminole | 0.0 /100 | #311 | Tragic 22.8% |
| Hondurans | 0.0 /100 | #312 | Tragic 23.0% |
| Bahamians | 0.0 /100 | #313 | Tragic 23.0% |
| U.S. Virgin Islanders | 0.0 /100 | #314 | Tragic 23.0% |
| Arapaho | 0.0 /100 | #315 | Tragic 23.1% |
| Yakama | 0.0 /100 | #316 | Tragic 23.1% |
| Menominee | 0.0 /100 | #317 | Tragic 23.3% |
| Dutch West Indians | 0.0 /100 | #318 | Tragic 23.3% |
Demographics Similar to Germans by Child Poverty Under the Age of 5
In terms of child poverty under the age of 5, the demographic groups most similar to Germans are Immigrants from Hungary (16.5%, a difference of 0.060%), Immigrants from Chile (16.4%, a difference of 0.10%), Guamanian/Chamorro (16.5%, a difference of 0.13%), Immigrants from Western Europe (16.5%, a difference of 0.32%), and Portuguese (16.5%, a difference of 0.36%).
| Demographics | Rating | Rank | Child Poverty Under the Age of 5 |
| Finns | 88.3 /100 | #131 | Excellent 16.3% |
| Serbians | 88.2 /100 | #132 | Excellent 16.3% |
| Icelanders | 87.9 /100 | #133 | Excellent 16.3% |
| Immigrants | North Macedonia | 87.8 /100 | #134 | Excellent 16.4% |
| Brazilians | 87.8 /100 | #135 | Excellent 16.4% |
| Immigrants | Northern Africa | 87.5 /100 | #136 | Excellent 16.4% |
| Immigrants | Chile | 85.3 /100 | #137 | Excellent 16.4% |
| Germans | 84.8 /100 | #138 | Excellent 16.5% |
| Immigrants | Hungary | 84.5 /100 | #139 | Excellent 16.5% |
| Guamanians/Chamorros | 84.2 /100 | #140 | Excellent 16.5% |
| Immigrants | Western Europe | 83.3 /100 | #141 | Excellent 16.5% |
| Portuguese | 83.0 /100 | #142 | Excellent 16.5% |
| Samoans | 83.0 /100 | #143 | Excellent 16.5% |
| Ethiopians | 82.7 /100 | #144 | Excellent 16.5% |
| Immigrants | Ethiopia | 82.1 /100 | #145 | Excellent 16.6% |