Mexican vs German Single Female Poverty
COMPARE
Mexican
German
Single Female Poverty
Single Female Poverty Comparison
Mexicans
Germans
25.0%
SINGLE FEMALE POVERTY
0.0/ 100
METRIC RATING
299th/ 347
METRIC RANK
21.8%
SINGLE FEMALE POVERTY
8.3/ 100
METRIC RATING
220th/ 347
METRIC RANK
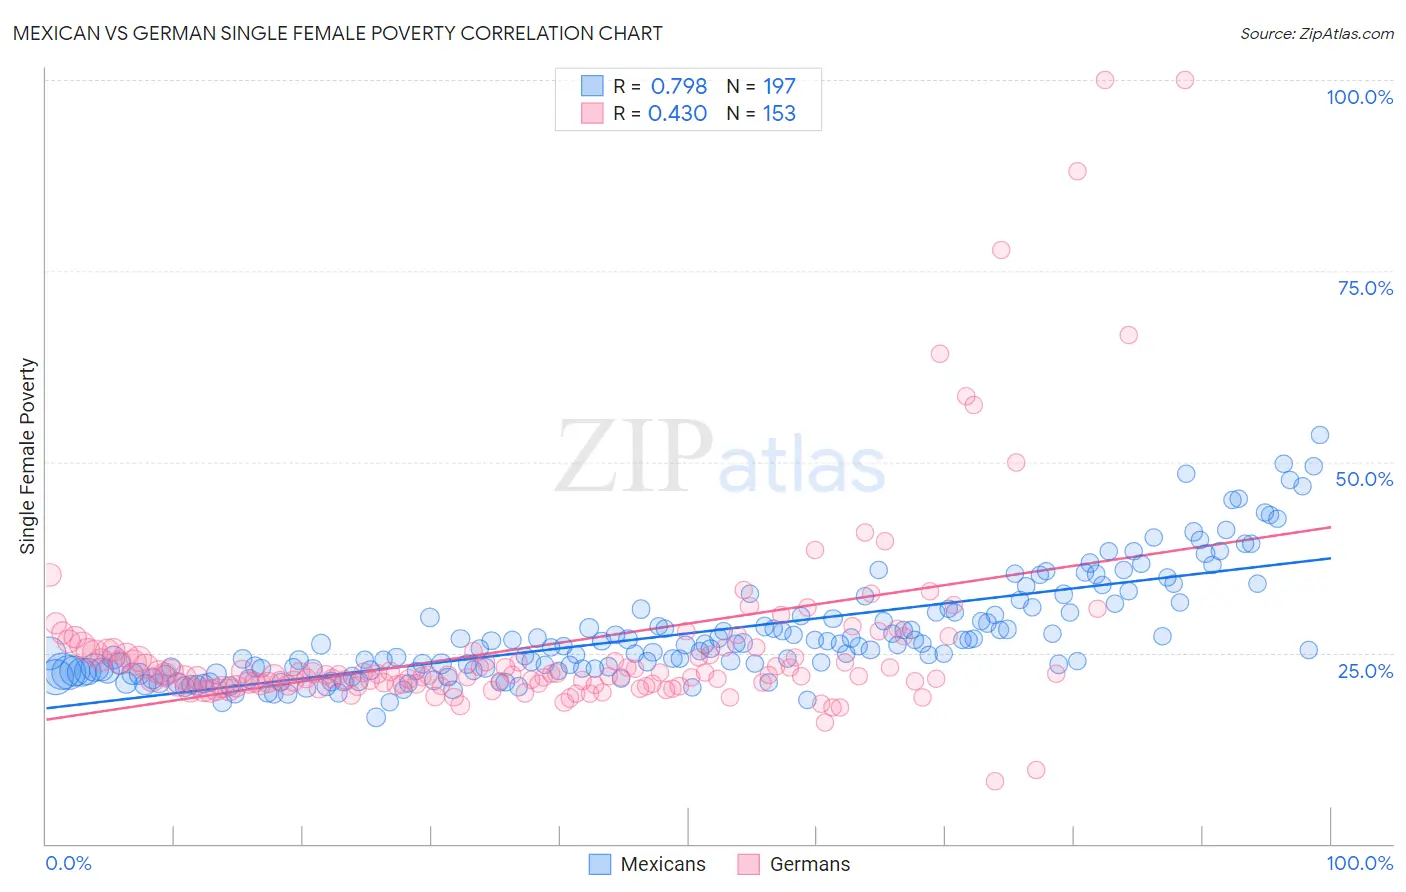
Mexican vs German Single Female Poverty Correlation Chart
The statistical analysis conducted on geographies consisting of 547,731,472 people shows a strong positive correlation between the proportion of Mexicans and poverty level among single females in the United States with a correlation coefficient (R) of 0.798 and weighted average of 25.0%. Similarly, the statistical analysis conducted on geographies consisting of 558,181,228 people shows a moderate positive correlation between the proportion of Germans and poverty level among single females in the United States with a correlation coefficient (R) of 0.430 and weighted average of 21.8%, a difference of 14.9%.
Single Female Poverty Correlation Summary
| Measurement | Mexican | German |
| Minimum | 16.6% | 8.2% |
| Maximum | 53.5% | 100.0% |
| Range | 36.9% | 91.8% |
| Mean | 27.4% | 26.0% |
| Median | 25.5% | 22.1% |
| Interquartile 25% (IQ1) | 22.6% | 20.8% |
| Interquartile 75% (IQ3) | 30.1% | 25.2% |
| Interquartile Range (IQR) | 7.5% | 4.3% |
| Standard Deviation (Sample) | 7.0% | 13.4% |
| Standard Deviation (Population) | 7.0% | 13.4% |
Similar Demographics by Single Female Poverty
Demographics Similar to Mexicans by Single Female Poverty
In terms of single female poverty, the demographic groups most similar to Mexicans are Blackfeet (25.1%, a difference of 0.080%), Honduran (25.1%, a difference of 0.25%), Shoshone (25.1%, a difference of 0.34%), Yaqui (24.9%, a difference of 0.67%), and Somali (25.2%, a difference of 0.74%).
| Demographics | Rating | Rank | Single Female Poverty |
| Alsatians | 0.0 /100 | #292 | Tragic 24.5% |
| Americans | 0.0 /100 | #293 | Tragic 24.5% |
| French American Indians | 0.0 /100 | #294 | Tragic 24.6% |
| Hispanics or Latinos | 0.0 /100 | #295 | Tragic 24.6% |
| Africans | 0.0 /100 | #296 | Tragic 24.8% |
| Immigrants | Central America | 0.0 /100 | #297 | Tragic 24.8% |
| Yaqui | 0.0 /100 | #298 | Tragic 24.9% |
| Mexicans | 0.0 /100 | #299 | Tragic 25.0% |
| Blackfeet | 0.0 /100 | #300 | Tragic 25.1% |
| Hondurans | 0.0 /100 | #301 | Tragic 25.1% |
| Shoshone | 0.0 /100 | #302 | Tragic 25.1% |
| Somalis | 0.0 /100 | #303 | Tragic 25.2% |
| Immigrants | Congo | 0.0 /100 | #304 | Tragic 25.3% |
| Immigrants | Dominican Republic | 0.0 /100 | #305 | Tragic 25.3% |
| Immigrants | Mexico | 0.0 /100 | #306 | Tragic 25.3% |
Demographics Similar to Germans by Single Female Poverty
In terms of single female poverty, the demographic groups most similar to Germans are Immigrants from Grenada (21.8%, a difference of 0.050%), Immigrants from Eritrea (21.8%, a difference of 0.070%), Panamanian (21.7%, a difference of 0.21%), Scottish (21.8%, a difference of 0.21%), and Barbadian (21.8%, a difference of 0.23%).
| Demographics | Rating | Rank | Single Female Poverty |
| Guamanians/Chamorros | 13.7 /100 | #213 | Poor 21.6% |
| Immigrants | Nicaragua | 13.3 /100 | #214 | Poor 21.6% |
| Ecuadorians | 12.3 /100 | #215 | Poor 21.6% |
| Immigrants | Barbados | 12.2 /100 | #216 | Poor 21.7% |
| Immigrants | St. Vincent and the Grenadines | 11.7 /100 | #217 | Poor 21.7% |
| Nepalese | 9.7 /100 | #218 | Tragic 21.7% |
| Panamanians | 9.4 /100 | #219 | Tragic 21.7% |
| Germans | 8.3 /100 | #220 | Tragic 21.8% |
| Immigrants | Grenada | 8.0 /100 | #221 | Tragic 21.8% |
| Immigrants | Eritrea | 7.9 /100 | #222 | Tragic 21.8% |
| Scottish | 7.3 /100 | #223 | Tragic 21.8% |
| Barbadians | 7.2 /100 | #224 | Tragic 21.8% |
| English | 6.4 /100 | #225 | Tragic 21.9% |
| Immigrants | Portugal | 5.8 /100 | #226 | Tragic 21.9% |
| Immigrants | Ghana | 5.8 /100 | #227 | Tragic 21.9% |