Scottish vs Immigrants from Liberia Professional Degree
COMPARE
Scottish
Immigrants from Liberia
Professional Degree
Professional Degree Comparison
Scottish
Immigrants from Liberia
4.6%
PROFESSIONAL DEGREE
71.8/ 100
METRIC RATING
154th/ 347
METRIC RANK
3.4%
PROFESSIONAL DEGREE
0.2/ 100
METRIC RATING
297th/ 347
METRIC RANK
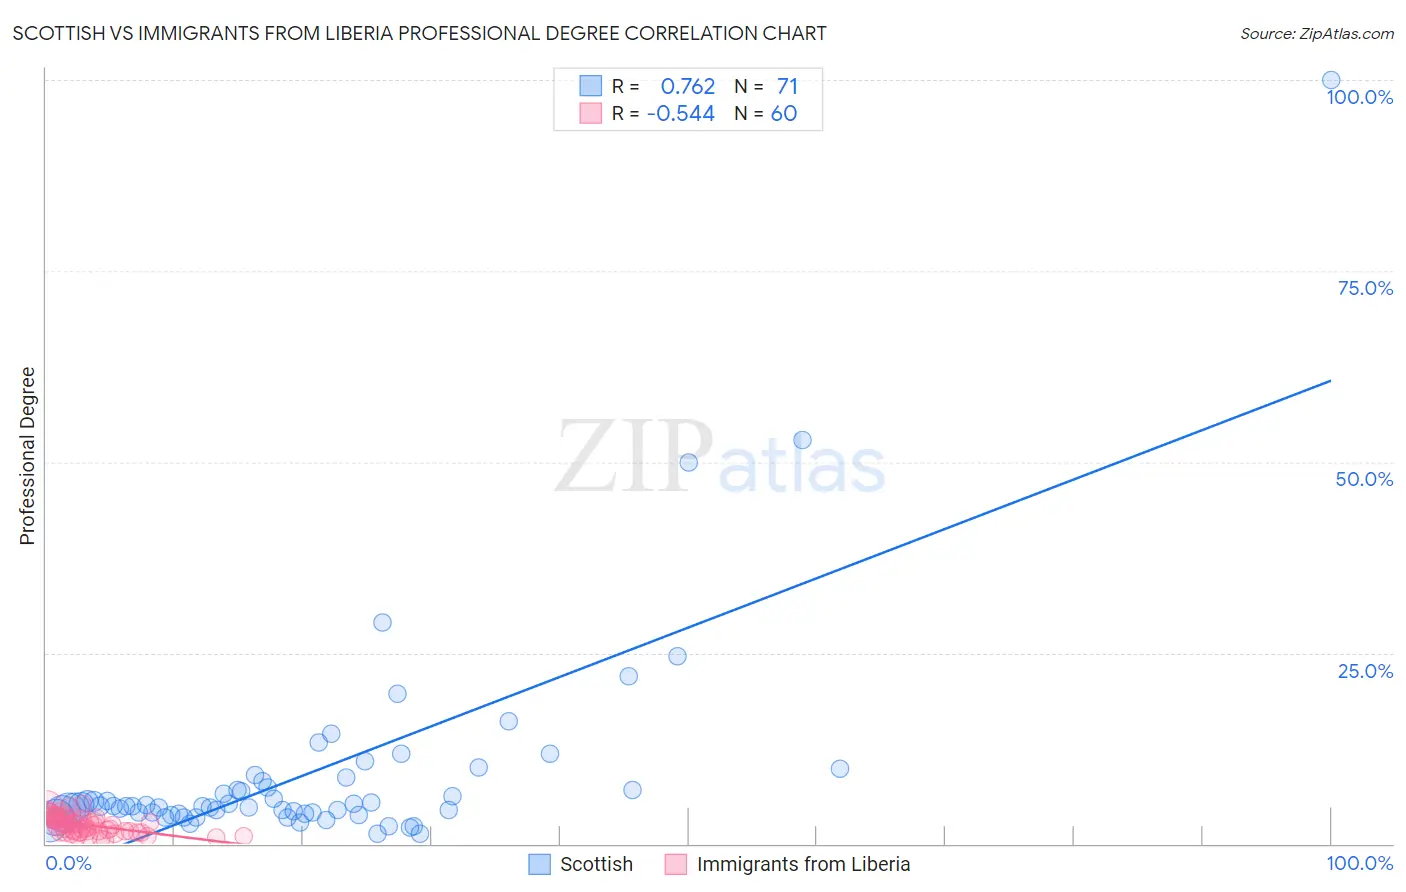
Scottish vs Immigrants from Liberia Professional Degree Correlation Chart
The statistical analysis conducted on geographies consisting of 558,904,242 people shows a strong positive correlation between the proportion of Scottish and percentage of population with at least professional degree education in the United States with a correlation coefficient (R) of 0.762 and weighted average of 4.6%. Similarly, the statistical analysis conducted on geographies consisting of 135,135,221 people shows a substantial negative correlation between the proportion of Immigrants from Liberia and percentage of population with at least professional degree education in the United States with a correlation coefficient (R) of -0.544 and weighted average of 3.4%, a difference of 32.8%.
Professional Degree Correlation Summary
| Measurement | Scottish | Immigrants from Liberia |
| Minimum | 1.3% | 0.44% |
| Maximum | 100.0% | 5.2% |
| Range | 98.7% | 4.7% |
| Mean | 9.2% | 2.5% |
| Median | 4.9% | 2.5% |
| Interquartile 25% (IQ1) | 4.0% | 1.5% |
| Interquartile 75% (IQ3) | 8.2% | 3.3% |
| Interquartile Range (IQR) | 4.2% | 1.7% |
| Standard Deviation (Sample) | 14.2% | 1.1% |
| Standard Deviation (Population) | 14.1% | 1.1% |
Similar Demographics by Professional Degree
Demographics Similar to Scottish by Professional Degree
In terms of professional degree, the demographic groups most similar to Scottish are Immigrants from Africa (4.6%, a difference of 0.12%), Immigrants from Uruguay (4.6%, a difference of 0.12%), Polish (4.6%, a difference of 0.14%), Slavic (4.5%, a difference of 0.18%), and Immigrants from Oceania (4.6%, a difference of 0.28%).
| Demographics | Rating | Rank | Professional Degree |
| Colombians | 77.7 /100 | #147 | Good 4.6% |
| Slovenes | 76.1 /100 | #148 | Good 4.6% |
| Senegalese | 75.3 /100 | #149 | Good 4.6% |
| Immigrants | Oceania | 73.4 /100 | #150 | Good 4.6% |
| Poles | 72.6 /100 | #151 | Good 4.6% |
| Immigrants | Africa | 72.5 /100 | #152 | Good 4.6% |
| Immigrants | Uruguay | 72.5 /100 | #153 | Good 4.6% |
| Scottish | 71.8 /100 | #154 | Good 4.6% |
| Slavs | 70.8 /100 | #155 | Good 4.5% |
| Swedes | 69.9 /100 | #156 | Good 4.5% |
| Iraqis | 69.8 /100 | #157 | Good 4.5% |
| Immigrants | Armenia | 68.8 /100 | #158 | Good 4.5% |
| Vietnamese | 68.4 /100 | #159 | Good 4.5% |
| Immigrants | Senegal | 68.0 /100 | #160 | Good 4.5% |
| Assyrians/Chaldeans/Syriacs | 67.4 /100 | #161 | Good 4.5% |
Demographics Similar to Immigrants from Liberia by Professional Degree
In terms of professional degree, the demographic groups most similar to Immigrants from Liberia are Ottawa (3.4%, a difference of 0.050%), Hawaiian (3.4%, a difference of 0.34%), Immigrants from Guatemala (3.4%, a difference of 0.35%), Paiute (3.4%, a difference of 0.50%), and Immigrants from Honduras (3.5%, a difference of 0.59%).
| Demographics | Rating | Rank | Professional Degree |
| Chippewa | 0.3 /100 | #290 | Tragic 3.5% |
| Alaska Natives | 0.3 /100 | #291 | Tragic 3.5% |
| Immigrants | Belize | 0.3 /100 | #292 | Tragic 3.5% |
| Immigrants | Honduras | 0.3 /100 | #293 | Tragic 3.5% |
| Paiute | 0.3 /100 | #294 | Tragic 3.4% |
| Immigrants | Guatemala | 0.2 /100 | #295 | Tragic 3.4% |
| Hawaiians | 0.2 /100 | #296 | Tragic 3.4% |
| Immigrants | Liberia | 0.2 /100 | #297 | Tragic 3.4% |
| Ottawa | 0.2 /100 | #298 | Tragic 3.4% |
| Immigrants | Yemen | 0.2 /100 | #299 | Tragic 3.4% |
| Blacks/African Americans | 0.2 /100 | #300 | Tragic 3.4% |
| Immigrants | Dominican Republic | 0.2 /100 | #301 | Tragic 3.4% |
| Malaysians | 0.2 /100 | #302 | Tragic 3.4% |
| Immigrants | Haiti | 0.2 /100 | #303 | Tragic 3.4% |
| Cajuns | 0.2 /100 | #304 | Tragic 3.4% |