Scottish vs Immigrants from Liberia Poverty
COMPARE
Scottish
Immigrants from Liberia
Poverty
Poverty Comparison
Scottish
Immigrants from Liberia
11.5%
POVERTY
94.0/ 100
METRIC RATING
100th/ 347
METRIC RANK
14.4%
POVERTY
0.1/ 100
METRIC RATING
262nd/ 347
METRIC RANK
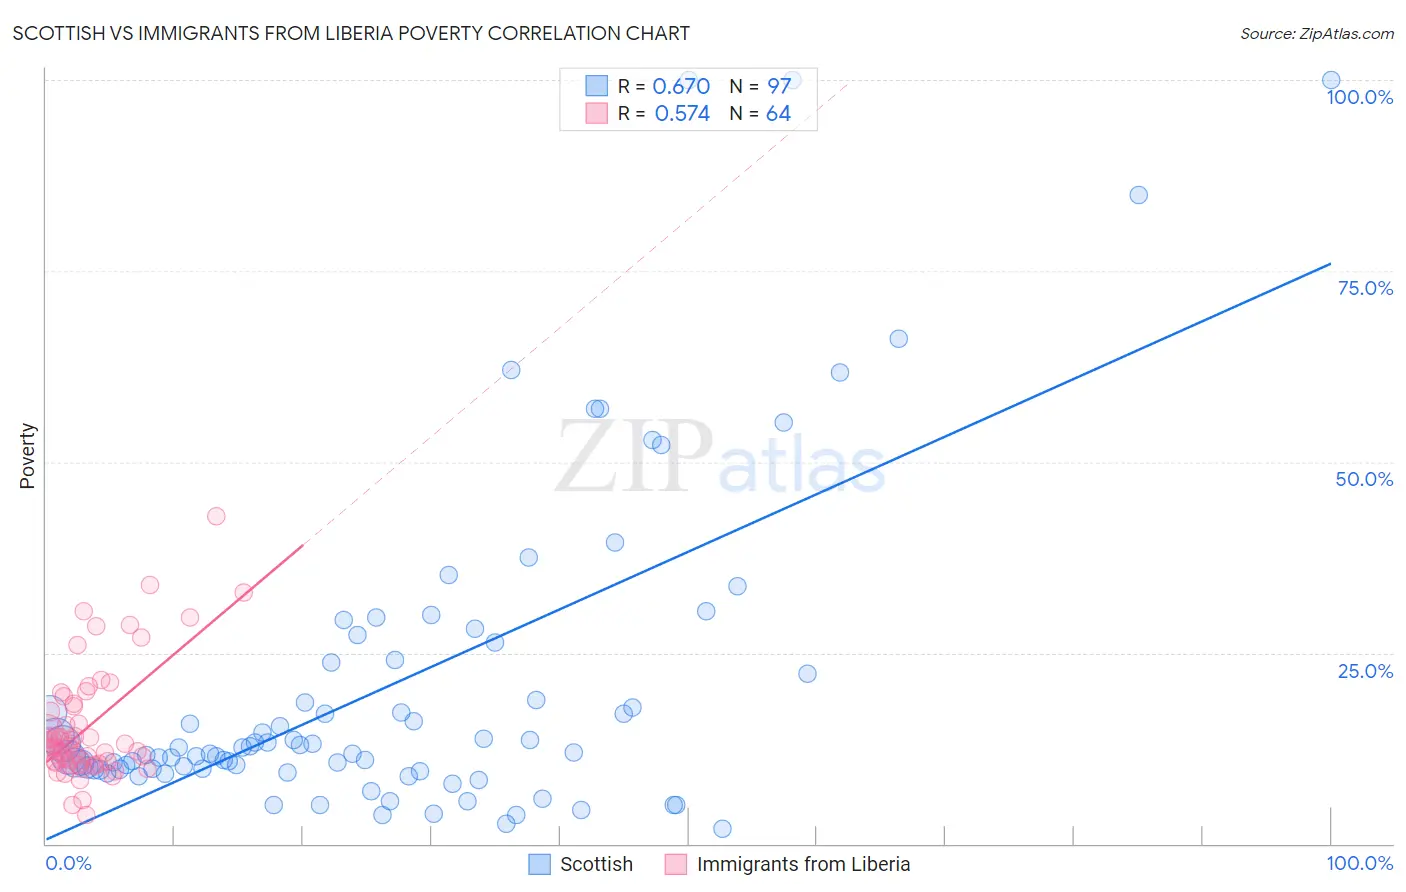
Scottish vs Immigrants from Liberia Poverty Correlation Chart
The statistical analysis conducted on geographies consisting of 566,309,495 people shows a significant positive correlation between the proportion of Scottish and poverty level in the United States with a correlation coefficient (R) of 0.670 and weighted average of 11.5%. Similarly, the statistical analysis conducted on geographies consisting of 135,251,059 people shows a substantial positive correlation between the proportion of Immigrants from Liberia and poverty level in the United States with a correlation coefficient (R) of 0.574 and weighted average of 14.4%, a difference of 25.1%.
Poverty Correlation Summary
| Measurement | Scottish | Immigrants from Liberia |
| Minimum | 1.9% | 3.7% |
| Maximum | 100.0% | 42.9% |
| Range | 98.1% | 39.2% |
| Mean | 20.9% | 15.3% |
| Median | 12.6% | 12.8% |
| Interquartile 25% (IQ1) | 9.8% | 10.7% |
| Interquartile 75% (IQ3) | 23.9% | 18.2% |
| Interquartile Range (IQR) | 14.1% | 7.5% |
| Standard Deviation (Sample) | 21.4% | 7.6% |
| Standard Deviation (Population) | 21.3% | 7.5% |
Similar Demographics by Poverty
Demographics Similar to Scottish by Poverty
In terms of poverty, the demographic groups most similar to Scottish are Immigrants from Indonesia (11.5%, a difference of 0.11%), Immigrants from Latvia (11.5%, a difference of 0.24%), Immigrants from Egypt (11.5%, a difference of 0.28%), Immigrants from South Africa (11.5%, a difference of 0.31%), and Slavic (11.5%, a difference of 0.31%).
| Demographics | Rating | Rank | Poverty |
| Romanians | 94.9 /100 | #93 | Exceptional 11.4% |
| Paraguayans | 94.9 /100 | #94 | Exceptional 11.4% |
| Australians | 94.9 /100 | #95 | Exceptional 11.4% |
| Immigrants | South Africa | 94.7 /100 | #96 | Exceptional 11.5% |
| Immigrants | Egypt | 94.6 /100 | #97 | Exceptional 11.5% |
| Immigrants | Latvia | 94.5 /100 | #98 | Exceptional 11.5% |
| Immigrants | Indonesia | 94.2 /100 | #99 | Exceptional 11.5% |
| Scottish | 94.0 /100 | #100 | Exceptional 11.5% |
| Slavs | 93.3 /100 | #101 | Exceptional 11.5% |
| Laotians | 92.4 /100 | #102 | Exceptional 11.6% |
| Okinawans | 92.4 /100 | #103 | Exceptional 11.6% |
| Native Hawaiians | 92.1 /100 | #104 | Exceptional 11.6% |
| Portuguese | 92.1 /100 | #105 | Exceptional 11.6% |
| Immigrants | Zimbabwe | 92.1 /100 | #106 | Exceptional 11.6% |
| Palestinians | 91.8 /100 | #107 | Exceptional 11.6% |
Demographics Similar to Immigrants from Liberia by Poverty
In terms of poverty, the demographic groups most similar to Immigrants from Liberia are Cherokee (14.4%, a difference of 0.16%), Cape Verdean (14.4%, a difference of 0.18%), Immigrants from Nicaragua (14.3%, a difference of 0.26%), Jamaican (14.4%, a difference of 0.35%), and Immigrants from Jamaica (14.4%, a difference of 0.43%).
| Demographics | Rating | Rank | Poverty |
| Immigrants | Ecuador | 0.1 /100 | #255 | Tragic 14.3% |
| Mexican American Indians | 0.1 /100 | #256 | Tragic 14.3% |
| Trinidadians and Tobagonians | 0.1 /100 | #257 | Tragic 14.3% |
| Ottawa | 0.1 /100 | #258 | Tragic 14.3% |
| Immigrants | Nicaragua | 0.1 /100 | #259 | Tragic 14.3% |
| Cape Verdeans | 0.1 /100 | #260 | Tragic 14.4% |
| Cherokee | 0.1 /100 | #261 | Tragic 14.4% |
| Immigrants | Liberia | 0.1 /100 | #262 | Tragic 14.4% |
| Jamaicans | 0.1 /100 | #263 | Tragic 14.4% |
| Immigrants | Jamaica | 0.1 /100 | #264 | Tragic 14.4% |
| Immigrants | Guyana | 0.1 /100 | #265 | Tragic 14.5% |
| Guyanese | 0.1 /100 | #266 | Tragic 14.5% |
| Iroquois | 0.1 /100 | #267 | Tragic 14.5% |
| Sub-Saharan Africans | 0.1 /100 | #268 | Tragic 14.5% |
| Immigrants | Cuba | 0.1 /100 | #269 | Tragic 14.6% |