Scottish vs Immigrants from Liberia Doctorate Degree
COMPARE
Scottish
Immigrants from Liberia
Doctorate Degree
Doctorate Degree Comparison
Scottish
Immigrants from Liberia
2.0%
DOCTORATE DEGREE
89.4/ 100
METRIC RATING
132nd/ 347
METRIC RANK
1.5%
DOCTORATE DEGREE
0.5/ 100
METRIC RATING
266th/ 347
METRIC RANK
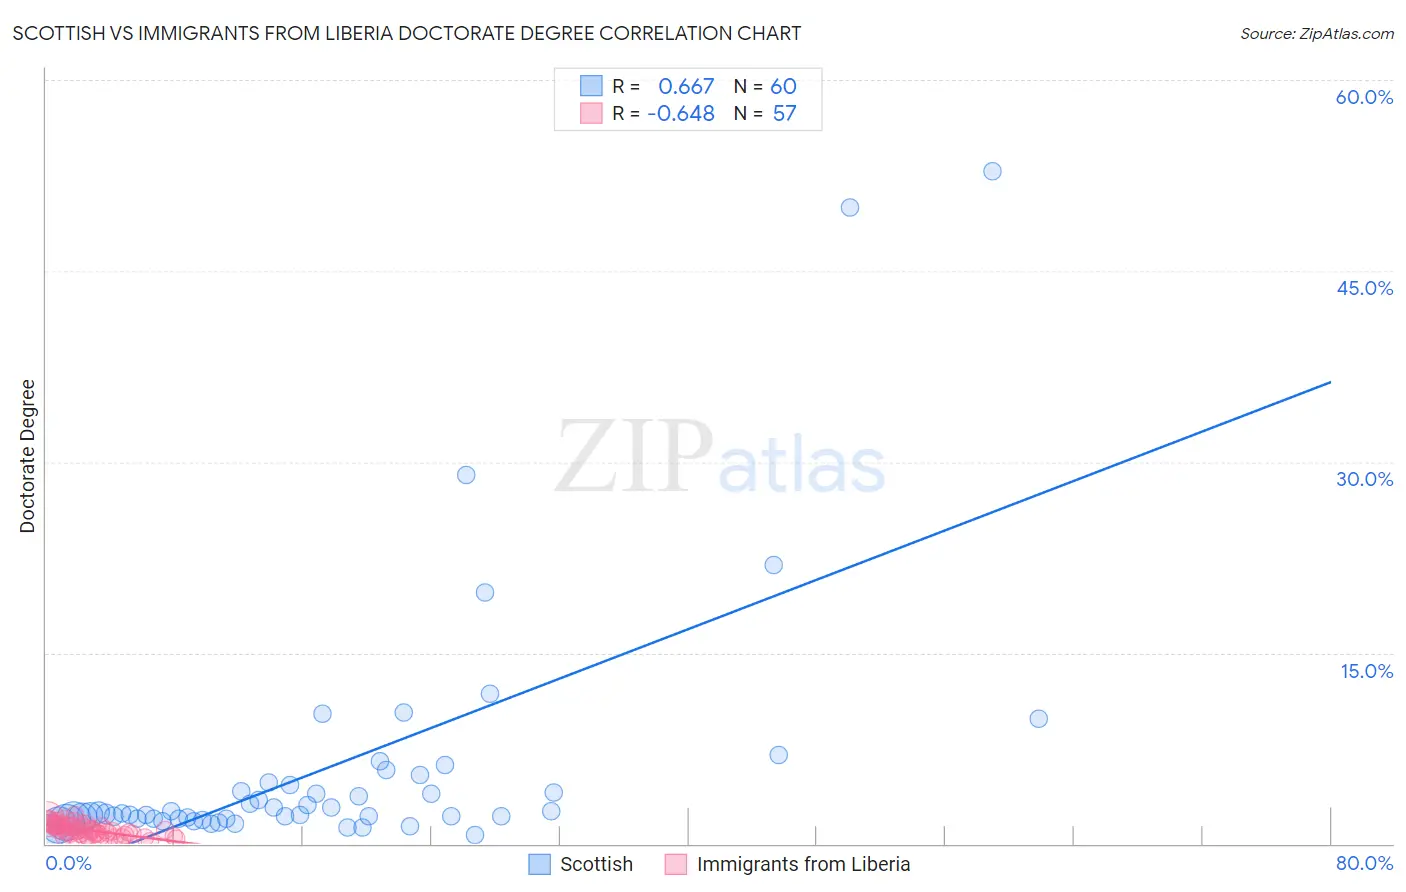
Scottish vs Immigrants from Liberia Doctorate Degree Correlation Chart
The statistical analysis conducted on geographies consisting of 542,697,657 people shows a significant positive correlation between the proportion of Scottish and percentage of population with at least doctorate degree education in the United States with a correlation coefficient (R) of 0.667 and weighted average of 2.0%. Similarly, the statistical analysis conducted on geographies consisting of 134,868,003 people shows a significant negative correlation between the proportion of Immigrants from Liberia and percentage of population with at least doctorate degree education in the United States with a correlation coefficient (R) of -0.648 and weighted average of 1.5%, a difference of 33.2%.
Doctorate Degree Correlation Summary
| Measurement | Scottish | Immigrants from Liberia |
| Minimum | 0.73% | 0.100% |
| Maximum | 52.8% | 2.2% |
| Range | 52.1% | 2.1% |
| Mean | 5.9% | 1.1% |
| Median | 2.4% | 1.0% |
| Interquartile 25% (IQ1) | 2.0% | 0.64% |
| Interquartile 75% (IQ3) | 4.7% | 1.5% |
| Interquartile Range (IQR) | 2.7% | 0.85% |
| Standard Deviation (Sample) | 9.9% | 0.51% |
| Standard Deviation (Population) | 9.9% | 0.50% |
Similar Demographics by Doctorate Degree
Demographics Similar to Scottish by Doctorate Degree
In terms of doctorate degree, the demographic groups most similar to Scottish are Immigrants from Uzbekistan (2.0%, a difference of 0.050%), Immigrants from Cameroon (2.0%, a difference of 0.20%), Serbian (2.0%, a difference of 0.26%), Immigrants from Sierra Leone (2.0%, a difference of 0.28%), and Immigrants from Ukraine (2.0%, a difference of 0.41%).
| Demographics | Rating | Rank | Doctorate Degree |
| Moroccans | 93.0 /100 | #125 | Exceptional 2.0% |
| Jordanians | 92.1 /100 | #126 | Exceptional 2.0% |
| Palestinians | 92.0 /100 | #127 | Exceptional 2.0% |
| Immigrants | Zaire | 91.1 /100 | #128 | Exceptional 2.0% |
| Canadians | 90.6 /100 | #129 | Exceptional 2.0% |
| Immigrants | Ukraine | 90.5 /100 | #130 | Exceptional 2.0% |
| Immigrants | Sierra Leone | 90.2 /100 | #131 | Exceptional 2.0% |
| Scottish | 89.4 /100 | #132 | Excellent 2.0% |
| Immigrants | Uzbekistan | 89.3 /100 | #133 | Excellent 2.0% |
| Immigrants | Cameroon | 88.9 /100 | #134 | Excellent 2.0% |
| Serbians | 88.7 /100 | #135 | Excellent 2.0% |
| Swedes | 88.3 /100 | #136 | Excellent 2.0% |
| South American Indians | 88.3 /100 | #137 | Excellent 2.0% |
| Swiss | 88.0 /100 | #138 | Excellent 2.0% |
| Afghans | 87.2 /100 | #139 | Excellent 2.0% |
Demographics Similar to Immigrants from Liberia by Doctorate Degree
In terms of doctorate degree, the demographic groups most similar to Immigrants from Liberia are Kiowa (1.5%, a difference of 0.65%), U.S. Virgin Islander (1.5%, a difference of 0.65%), Crow (1.5%, a difference of 0.74%), Salvadoran (1.5%, a difference of 0.77%), and Nicaraguan (1.5%, a difference of 0.78%).
| Demographics | Rating | Rank | Doctorate Degree |
| Liberians | 0.9 /100 | #259 | Tragic 1.5% |
| Japanese | 0.9 /100 | #260 | Tragic 1.5% |
| Immigrants | Portugal | 0.8 /100 | #261 | Tragic 1.5% |
| Chickasaw | 0.7 /100 | #262 | Tragic 1.5% |
| Immigrants | Bahamas | 0.7 /100 | #263 | Tragic 1.5% |
| Blackfeet | 0.7 /100 | #264 | Tragic 1.5% |
| Nicaraguans | 0.6 /100 | #265 | Tragic 1.5% |
| Immigrants | Liberia | 0.5 /100 | #266 | Tragic 1.5% |
| Kiowa | 0.5 /100 | #267 | Tragic 1.5% |
| U.S. Virgin Islanders | 0.5 /100 | #268 | Tragic 1.5% |
| Crow | 0.5 /100 | #269 | Tragic 1.5% |
| Salvadorans | 0.5 /100 | #270 | Tragic 1.5% |
| Immigrants | Trinidad and Tobago | 0.5 /100 | #271 | Tragic 1.5% |
| Immigrants | Barbados | 0.4 /100 | #272 | Tragic 1.5% |
| Sioux | 0.4 /100 | #273 | Tragic 1.5% |