Mongolian vs Immigrants from Liberia Family Poverty
COMPARE
Mongolian
Immigrants from Liberia
Family Poverty
Family Poverty Comparison
Mongolians
Immigrants from Liberia
8.6%
FAMILY POVERTY
80.4/ 100
METRIC RATING
149th/ 347
METRIC RANK
10.8%
FAMILY POVERTY
0.2/ 100
METRIC RATING
255th/ 347
METRIC RANK
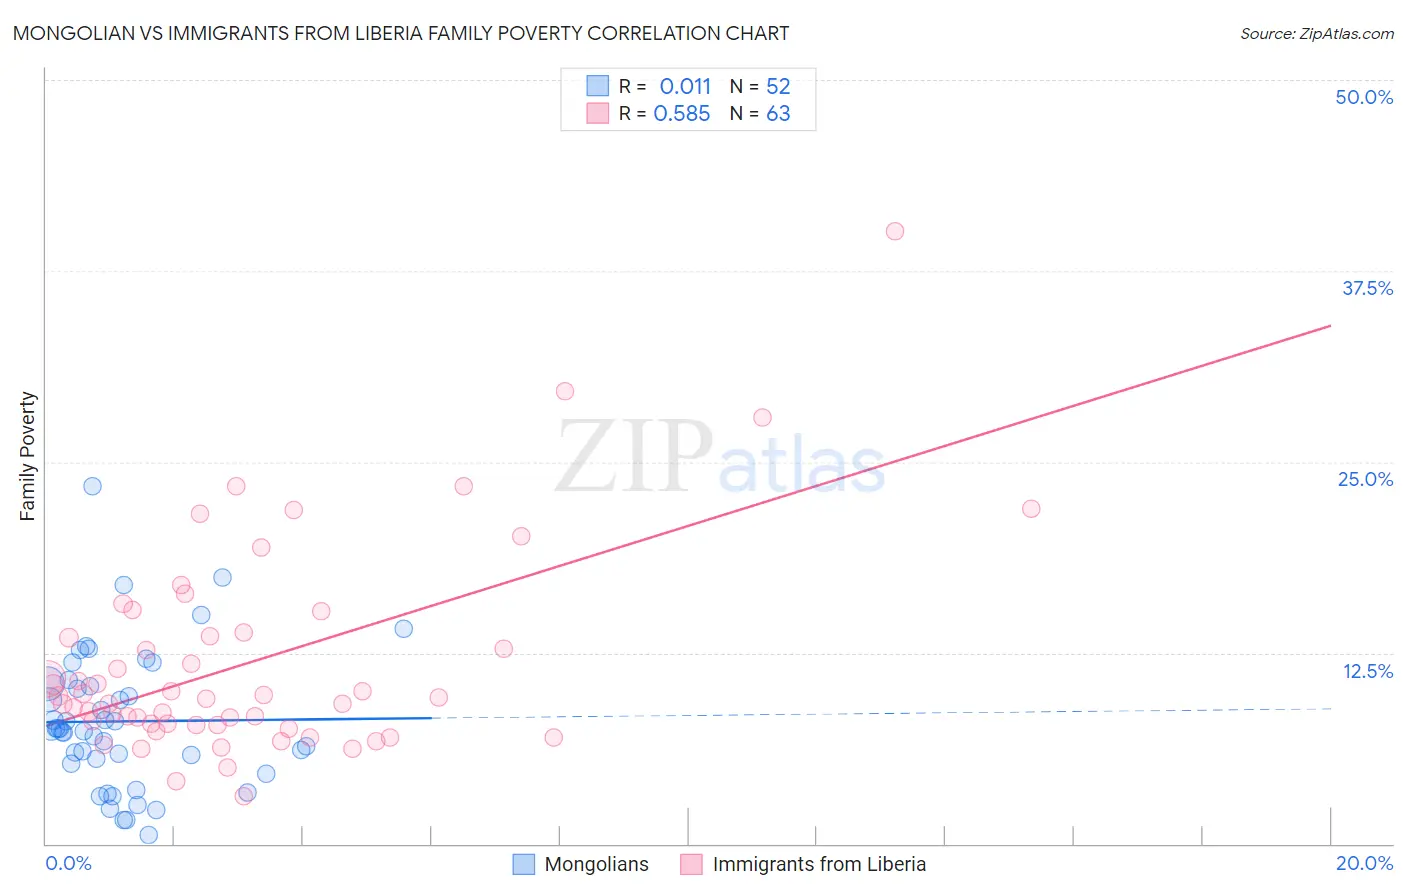
Mongolian vs Immigrants from Liberia Family Poverty Correlation Chart
The statistical analysis conducted on geographies consisting of 140,209,736 people shows no correlation between the proportion of Mongolians and poverty level among families in the United States with a correlation coefficient (R) of 0.011 and weighted average of 8.6%. Similarly, the statistical analysis conducted on geographies consisting of 135,184,573 people shows a substantial positive correlation between the proportion of Immigrants from Liberia and poverty level among families in the United States with a correlation coefficient (R) of 0.585 and weighted average of 10.8%, a difference of 25.9%.
Family Poverty Correlation Summary
| Measurement | Mongolian | Immigrants from Liberia |
| Minimum | 0.58% | 3.1% |
| Maximum | 23.4% | 40.1% |
| Range | 22.8% | 37.0% |
| Mean | 8.0% | 11.9% |
| Median | 7.5% | 9.6% |
| Interquartile 25% (IQ1) | 5.4% | 7.8% |
| Interquartile 75% (IQ3) | 10.4% | 13.8% |
| Interquartile Range (IQR) | 4.9% | 6.0% |
| Standard Deviation (Sample) | 4.5% | 6.8% |
| Standard Deviation (Population) | 4.5% | 6.7% |
Similar Demographics by Family Poverty
Demographics Similar to Mongolians by Family Poverty
In terms of family poverty, the demographic groups most similar to Mongolians are Syrian (8.6%, a difference of 0.0%), Brazilian (8.6%, a difference of 0.050%), Samoan (8.6%, a difference of 0.13%), Immigrants from Spain (8.6%, a difference of 0.26%), and Scotch-Irish (8.6%, a difference of 0.41%).
| Demographics | Rating | Rank | Family Poverty |
| Yugoslavians | 83.5 /100 | #142 | Excellent 8.5% |
| Immigrants | Germany | 83.3 /100 | #143 | Excellent 8.5% |
| Albanians | 83.3 /100 | #144 | Excellent 8.5% |
| Immigrants | South Eastern Asia | 83.2 /100 | #145 | Excellent 8.5% |
| Immigrants | Belarus | 83.2 /100 | #146 | Excellent 8.5% |
| Immigrants | Jordan | 83.0 /100 | #147 | Excellent 8.5% |
| Scotch-Irish | 82.2 /100 | #148 | Excellent 8.6% |
| Mongolians | 80.4 /100 | #149 | Excellent 8.6% |
| Syrians | 80.3 /100 | #150 | Excellent 8.6% |
| Brazilians | 80.1 /100 | #151 | Excellent 8.6% |
| Samoans | 79.8 /100 | #152 | Good 8.6% |
| Immigrants | Spain | 79.1 /100 | #153 | Good 8.6% |
| Immigrants | Vietnam | 75.4 /100 | #154 | Good 8.7% |
| Immigrants | Kuwait | 73.6 /100 | #155 | Good 8.7% |
| Immigrants | Oceania | 71.2 /100 | #156 | Good 8.7% |
Demographics Similar to Immigrants from Liberia by Family Poverty
In terms of family poverty, the demographic groups most similar to Immigrants from Liberia are Chickasaw (10.8%, a difference of 0.26%), Immigrants from Ghana (10.8%, a difference of 0.30%), Subsaharan African (10.9%, a difference of 0.34%), Ecuadorian (10.8%, a difference of 0.37%), and Mexican American Indian (10.9%, a difference of 0.38%).
| Demographics | Rating | Rank | Family Poverty |
| Nicaraguans | 0.4 /100 | #248 | Tragic 10.6% |
| Cubans | 0.4 /100 | #249 | Tragic 10.6% |
| Salvadorans | 0.3 /100 | #250 | Tragic 10.7% |
| Iroquois | 0.3 /100 | #251 | Tragic 10.7% |
| Immigrants | Zaire | 0.3 /100 | #252 | Tragic 10.7% |
| Immigrants | Western Africa | 0.3 /100 | #253 | Tragic 10.7% |
| Ecuadorians | 0.2 /100 | #254 | Tragic 10.8% |
| Immigrants | Liberia | 0.2 /100 | #255 | Tragic 10.8% |
| Chickasaw | 0.2 /100 | #256 | Tragic 10.8% |
| Immigrants | Ghana | 0.2 /100 | #257 | Tragic 10.8% |
| Sub-Saharan Africans | 0.2 /100 | #258 | Tragic 10.9% |
| Mexican American Indians | 0.2 /100 | #259 | Tragic 10.9% |
| Bangladeshis | 0.2 /100 | #260 | Tragic 10.9% |
| Shoshone | 0.2 /100 | #261 | Tragic 10.9% |
| Spanish American Indians | 0.2 /100 | #262 | Tragic 10.9% |