Scottish vs Immigrants from Fiji In Labor Force | Age 25-29
COMPARE
Scottish
Immigrants from Fiji
In Labor Force | Age 25-29
In Labor Force | Age 25-29 Comparison
Scottish
Immigrants from Fiji
84.6%
IN LABOR FORCE | AGE 25-29
40.1/ 100
METRIC RATING
183rd/ 347
METRIC RANK
83.6%
IN LABOR FORCE | AGE 25-29
0.1/ 100
METRIC RATING
262nd/ 347
METRIC RANK
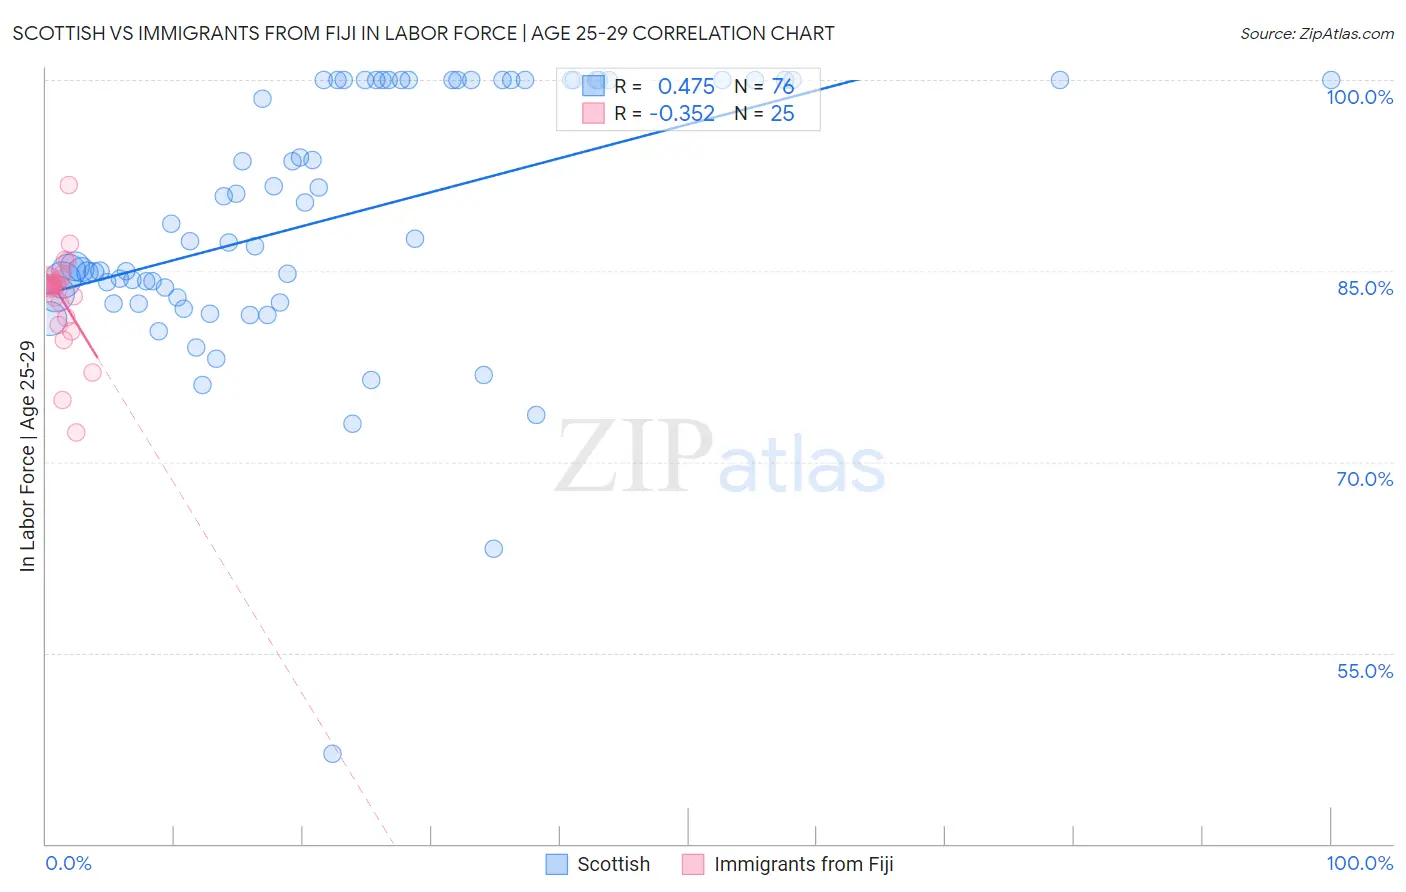
Scottish vs Immigrants from Fiji In Labor Force | Age 25-29 Correlation Chart
The statistical analysis conducted on geographies consisting of 565,804,130 people shows a moderate positive correlation between the proportion of Scottish and labor force participation rate among population between the ages 25 and 29 in the United States with a correlation coefficient (R) of 0.475 and weighted average of 84.6%. Similarly, the statistical analysis conducted on geographies consisting of 93,752,229 people shows a mild negative correlation between the proportion of Immigrants from Fiji and labor force participation rate among population between the ages 25 and 29 in the United States with a correlation coefficient (R) of -0.352 and weighted average of 83.6%, a difference of 1.2%.
In Labor Force | Age 25-29 Correlation Summary
| Measurement | Scottish | Immigrants from Fiji |
| Minimum | 47.0% | 72.3% |
| Maximum | 100.0% | 91.7% |
| Range | 53.0% | 19.4% |
| Mean | 89.2% | 82.8% |
| Median | 87.4% | 83.9% |
| Interquartile 25% (IQ1) | 83.1% | 81.1% |
| Interquartile 75% (IQ3) | 100.0% | 84.4% |
| Interquartile Range (IQR) | 16.9% | 3.3% |
| Standard Deviation (Sample) | 10.2% | 3.9% |
| Standard Deviation (Population) | 10.1% | 3.8% |
Similar Demographics by In Labor Force | Age 25-29
Demographics Similar to Scottish by In Labor Force | Age 25-29
In terms of in labor force | age 25-29, the demographic groups most similar to Scottish are European (84.6%, a difference of 0.0%), Immigrants from Norway (84.6%, a difference of 0.010%), Immigrants from Kuwait (84.6%, a difference of 0.010%), Immigrants from South America (84.6%, a difference of 0.020%), and Immigrants from Denmark (84.6%, a difference of 0.020%).
| Demographics | Rating | Rank | In Labor Force | Age 25-29 |
| Malaysians | 46.8 /100 | #176 | Average 84.6% |
| Immigrants | China | 45.7 /100 | #177 | Average 84.6% |
| Immigrants | Thailand | 45.2 /100 | #178 | Average 84.6% |
| Immigrants | Argentina | 44.0 /100 | #179 | Average 84.6% |
| Immigrants | South America | 42.9 /100 | #180 | Average 84.6% |
| Immigrants | Norway | 41.9 /100 | #181 | Average 84.6% |
| Europeans | 40.3 /100 | #182 | Average 84.6% |
| Scottish | 40.1 /100 | #183 | Average 84.6% |
| Immigrants | Kuwait | 38.2 /100 | #184 | Fair 84.6% |
| Immigrants | Denmark | 37.0 /100 | #185 | Fair 84.6% |
| Immigrants | Belgium | 35.0 /100 | #186 | Fair 84.6% |
| Immigrants | Portugal | 34.7 /100 | #187 | Fair 84.6% |
| Immigrants | Ukraine | 33.7 /100 | #188 | Fair 84.5% |
| Moroccans | 32.6 /100 | #189 | Fair 84.5% |
| Welsh | 31.1 /100 | #190 | Fair 84.5% |
Demographics Similar to Immigrants from Fiji by In Labor Force | Age 25-29
In terms of in labor force | age 25-29, the demographic groups most similar to Immigrants from Fiji are West Indian (83.5%, a difference of 0.040%), Pennsylvania German (83.6%, a difference of 0.060%), Immigrants from Bahamas (83.6%, a difference of 0.070%), Immigrants from Guatemala (83.6%, a difference of 0.080%), and Spanish (83.6%, a difference of 0.080%).
| Demographics | Rating | Rank | In Labor Force | Age 25-29 |
| Haitians | 0.2 /100 | #255 | Tragic 83.7% |
| Immigrants | Haiti | 0.2 /100 | #256 | Tragic 83.7% |
| Delaware | 0.2 /100 | #257 | Tragic 83.7% |
| Immigrants | Guatemala | 0.1 /100 | #258 | Tragic 83.6% |
| Spanish | 0.1 /100 | #259 | Tragic 83.6% |
| Immigrants | Bahamas | 0.1 /100 | #260 | Tragic 83.6% |
| Pennsylvania Germans | 0.1 /100 | #261 | Tragic 83.6% |
| Immigrants | Fiji | 0.1 /100 | #262 | Tragic 83.6% |
| West Indians | 0.1 /100 | #263 | Tragic 83.5% |
| Puget Sound Salish | 0.1 /100 | #264 | Tragic 83.5% |
| Cubans | 0.1 /100 | #265 | Tragic 83.5% |
| Aleuts | 0.0 /100 | #266 | Tragic 83.4% |
| Spanish Americans | 0.0 /100 | #267 | Tragic 83.4% |
| Immigrants | Lebanon | 0.0 /100 | #268 | Tragic 83.4% |
| Immigrants | Barbados | 0.0 /100 | #269 | Tragic 83.4% |