Scottish vs Immigrants from Fiji Doctorate Degree
COMPARE
Scottish
Immigrants from Fiji
Doctorate Degree
Doctorate Degree Comparison
Scottish
Immigrants from Fiji
2.0%
DOCTORATE DEGREE
89.4/ 100
METRIC RATING
132nd/ 347
METRIC RANK
1.6%
DOCTORATE DEGREE
1.6/ 100
METRIC RATING
250th/ 347
METRIC RANK
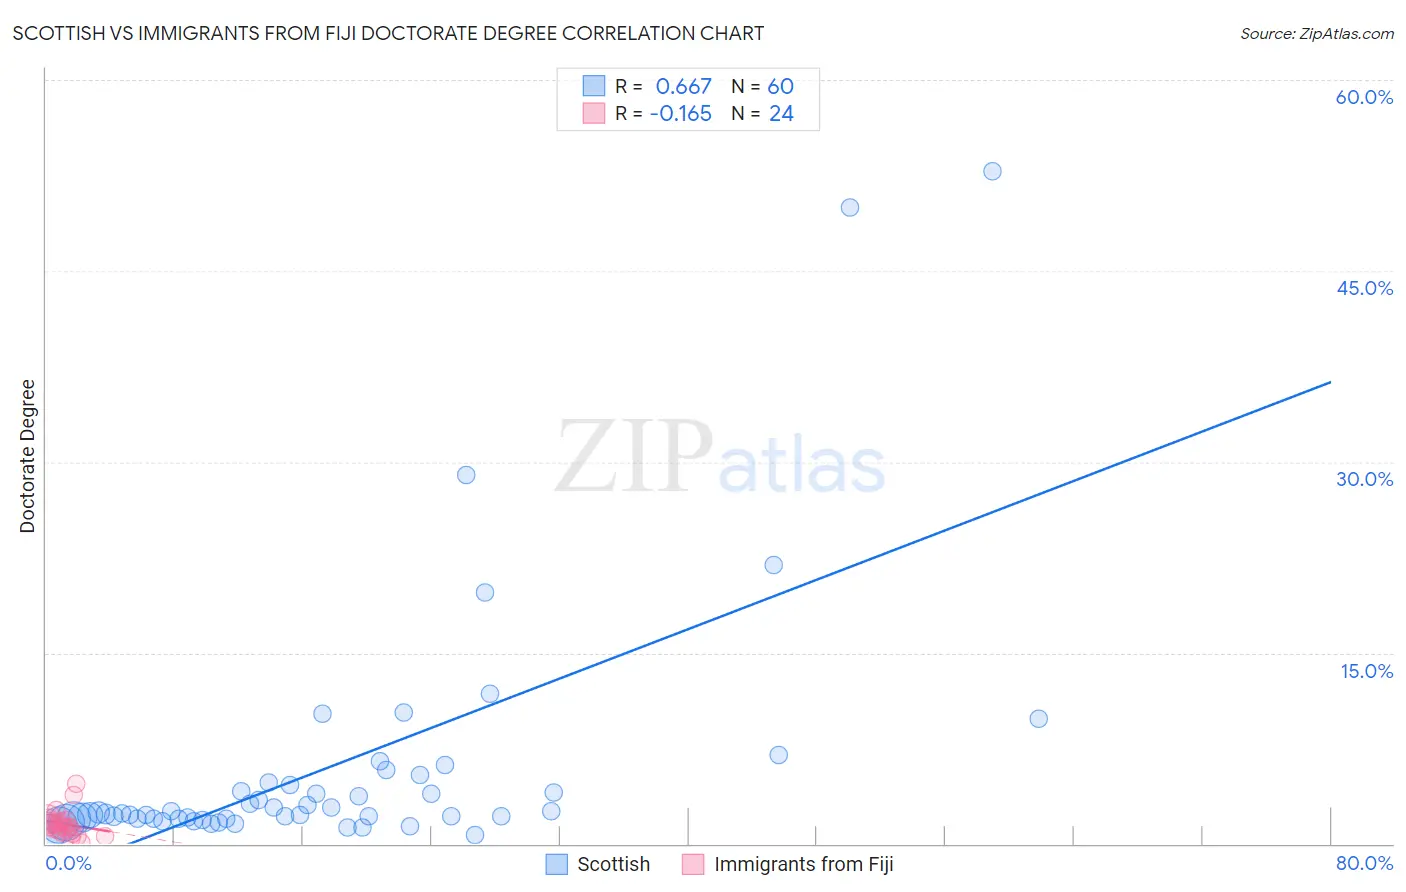
Scottish vs Immigrants from Fiji Doctorate Degree Correlation Chart
The statistical analysis conducted on geographies consisting of 542,697,657 people shows a significant positive correlation between the proportion of Scottish and percentage of population with at least doctorate degree education in the United States with a correlation coefficient (R) of 0.667 and weighted average of 2.0%. Similarly, the statistical analysis conducted on geographies consisting of 93,573,075 people shows a poor negative correlation between the proportion of Immigrants from Fiji and percentage of population with at least doctorate degree education in the United States with a correlation coefficient (R) of -0.165 and weighted average of 1.6%, a difference of 27.1%.
Doctorate Degree Correlation Summary
| Measurement | Scottish | Immigrants from Fiji |
| Minimum | 0.73% | 0.14% |
| Maximum | 52.8% | 4.7% |
| Range | 52.1% | 4.5% |
| Mean | 5.9% | 1.5% |
| Median | 2.4% | 1.4% |
| Interquartile 25% (IQ1) | 2.0% | 0.99% |
| Interquartile 75% (IQ3) | 4.7% | 1.8% |
| Interquartile Range (IQR) | 2.7% | 0.82% |
| Standard Deviation (Sample) | 9.9% | 1.0% |
| Standard Deviation (Population) | 9.9% | 0.99% |
Similar Demographics by Doctorate Degree
Demographics Similar to Scottish by Doctorate Degree
In terms of doctorate degree, the demographic groups most similar to Scottish are Immigrants from Uzbekistan (2.0%, a difference of 0.050%), Immigrants from Cameroon (2.0%, a difference of 0.20%), Serbian (2.0%, a difference of 0.26%), Immigrants from Sierra Leone (2.0%, a difference of 0.28%), and Immigrants from Ukraine (2.0%, a difference of 0.41%).
| Demographics | Rating | Rank | Doctorate Degree |
| Moroccans | 93.0 /100 | #125 | Exceptional 2.0% |
| Jordanians | 92.1 /100 | #126 | Exceptional 2.0% |
| Palestinians | 92.0 /100 | #127 | Exceptional 2.0% |
| Immigrants | Zaire | 91.1 /100 | #128 | Exceptional 2.0% |
| Canadians | 90.6 /100 | #129 | Exceptional 2.0% |
| Immigrants | Ukraine | 90.5 /100 | #130 | Exceptional 2.0% |
| Immigrants | Sierra Leone | 90.2 /100 | #131 | Exceptional 2.0% |
| Scottish | 89.4 /100 | #132 | Excellent 2.0% |
| Immigrants | Uzbekistan | 89.3 /100 | #133 | Excellent 2.0% |
| Immigrants | Cameroon | 88.9 /100 | #134 | Excellent 2.0% |
| Serbians | 88.7 /100 | #135 | Excellent 2.0% |
| Swedes | 88.3 /100 | #136 | Excellent 2.0% |
| South American Indians | 88.3 /100 | #137 | Excellent 2.0% |
| Swiss | 88.0 /100 | #138 | Excellent 2.0% |
| Afghans | 87.2 /100 | #139 | Excellent 2.0% |
Demographics Similar to Immigrants from Fiji by Doctorate Degree
In terms of doctorate degree, the demographic groups most similar to Immigrants from Fiji are Potawatomi (1.6%, a difference of 0.030%), African (1.6%, a difference of 0.50%), Comanche (1.6%, a difference of 0.61%), Hmong (1.6%, a difference of 0.63%), and Delaware (1.6%, a difference of 0.73%).
| Demographics | Rating | Rank | Doctorate Degree |
| Native Hawaiians | 2.1 /100 | #243 | Tragic 1.6% |
| French American Indians | 2.0 /100 | #244 | Tragic 1.6% |
| Delaware | 1.9 /100 | #245 | Tragic 1.6% |
| Hmong | 1.8 /100 | #246 | Tragic 1.6% |
| Comanche | 1.8 /100 | #247 | Tragic 1.6% |
| Africans | 1.8 /100 | #248 | Tragic 1.6% |
| Potawatomi | 1.6 /100 | #249 | Tragic 1.6% |
| Immigrants | Fiji | 1.6 /100 | #250 | Tragic 1.6% |
| Apache | 1.3 /100 | #251 | Tragic 1.5% |
| Yuman | 1.1 /100 | #252 | Tragic 1.5% |
| Americans | 1.0 /100 | #253 | Tragic 1.5% |
| Immigrants | Cambodia | 1.0 /100 | #254 | Tragic 1.5% |
| Trinidadians and Tobagonians | 1.0 /100 | #255 | Tragic 1.5% |
| Central American Indians | 1.0 /100 | #256 | Tragic 1.5% |
| Chippewa | 0.9 /100 | #257 | Tragic 1.5% |