Scottish vs Immigrants from Congo Unemployment Among Seniors over 75 years
COMPARE
Scottish
Immigrants from Congo
Unemployment Among Seniors over 75 years
Unemployment Among Seniors over 75 years Comparison
Scottish
Immigrants from Congo
10.1%
UNEMPLOYMENT AMONG SENIORS OVER 75 YEARS
0.0/ 100
METRIC RATING
311th/ 347
METRIC RANK
6.7%
UNEMPLOYMENT AMONG SENIORS OVER 75 YEARS
100.0/ 100
METRIC RATING
13th/ 347
METRIC RANK
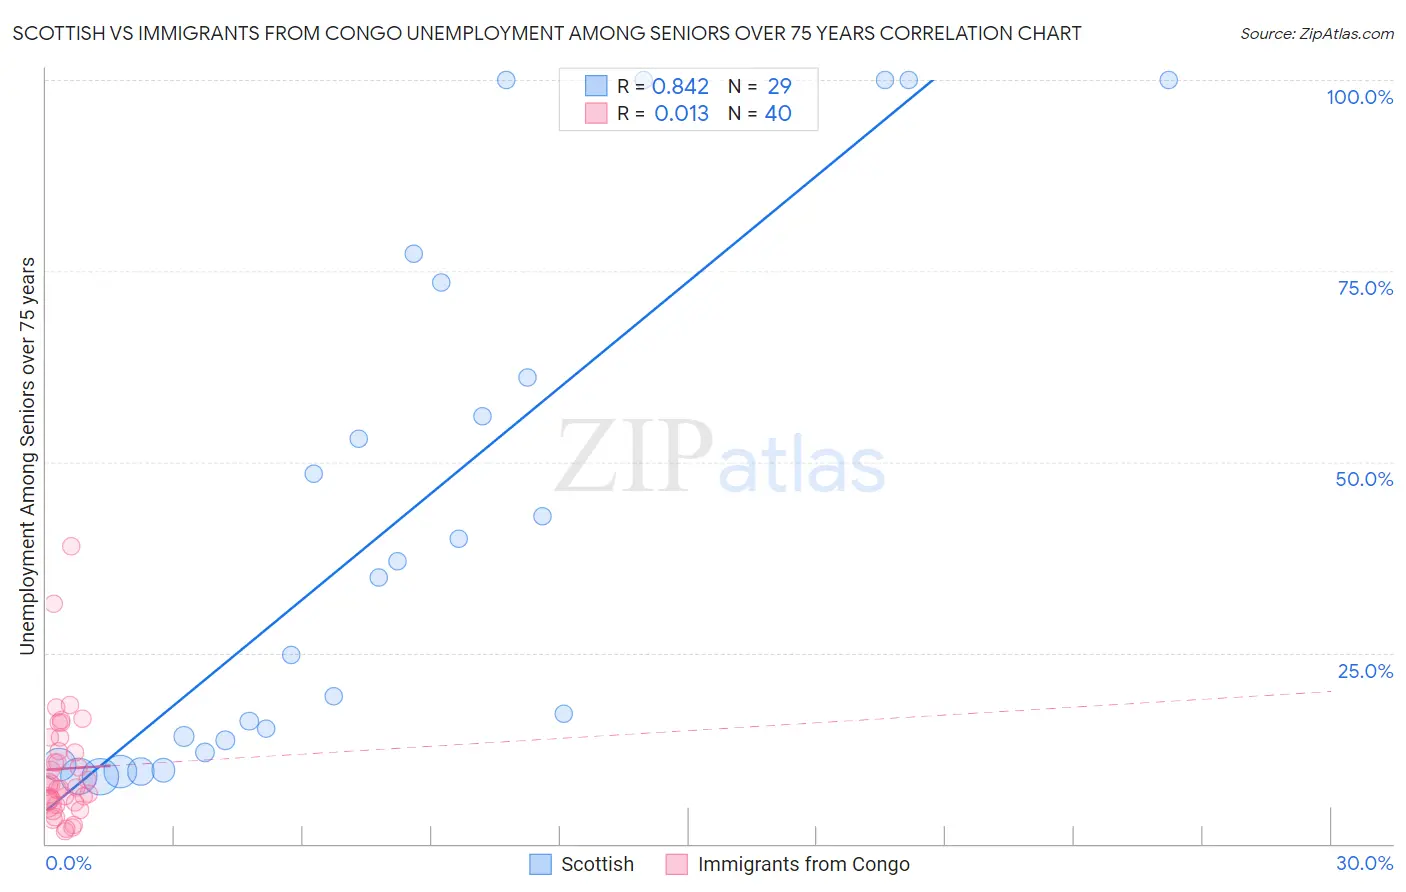
Scottish vs Immigrants from Congo Unemployment Among Seniors over 75 years Correlation Chart
The statistical analysis conducted on geographies consisting of 233,245,768 people shows a very strong positive correlation between the proportion of Scottish and unemployment rate among seniors over the age of 75 in the United States with a correlation coefficient (R) of 0.842 and weighted average of 10.1%. Similarly, the statistical analysis conducted on geographies consisting of 70,470,429 people shows no correlation between the proportion of Immigrants from Congo and unemployment rate among seniors over the age of 75 in the United States with a correlation coefficient (R) of 0.013 and weighted average of 6.7%, a difference of 50.0%.
Unemployment Among Seniors over 75 years Correlation Summary
| Measurement | Scottish | Immigrants from Congo |
| Minimum | 8.8% | 1.6% |
| Maximum | 100.0% | 38.9% |
| Range | 91.2% | 37.3% |
| Mean | 41.8% | 9.8% |
| Median | 34.9% | 7.4% |
| Interquartile 25% (IQ1) | 12.7% | 5.4% |
| Interquartile 75% (IQ3) | 67.3% | 13.0% |
| Interquartile Range (IQR) | 54.6% | 7.6% |
| Standard Deviation (Sample) | 33.6% | 7.5% |
| Standard Deviation (Population) | 33.0% | 7.4% |
Similar Demographics by Unemployment Among Seniors over 75 years
Demographics Similar to Scottish by Unemployment Among Seniors over 75 years
In terms of unemployment among seniors over 75 years, the demographic groups most similar to Scottish are Chippewa (10.1%, a difference of 0.010%), Hungarian (10.1%, a difference of 0.11%), Nepalese (10.1%, a difference of 0.13%), English (10.1%, a difference of 0.30%), and White/Caucasian (10.1%, a difference of 0.37%).
| Demographics | Rating | Rank | Unemployment Among Seniors over 75 years |
| Scotch-Irish | 0.0 /100 | #304 | Tragic 10.0% |
| Swedes | 0.0 /100 | #305 | Tragic 10.0% |
| Italians | 0.0 /100 | #306 | Tragic 10.0% |
| Immigrants | Fiji | 0.0 /100 | #307 | Tragic 10.0% |
| Whites/Caucasians | 0.0 /100 | #308 | Tragic 10.1% |
| English | 0.0 /100 | #309 | Tragic 10.1% |
| Hungarians | 0.0 /100 | #310 | Tragic 10.1% |
| Scottish | 0.0 /100 | #311 | Tragic 10.1% |
| Chippewa | 0.0 /100 | #312 | Tragic 10.1% |
| Nepalese | 0.0 /100 | #313 | Tragic 10.1% |
| Dutch West Indians | 0.0 /100 | #314 | Tragic 10.2% |
| Pennsylvania Germans | 0.0 /100 | #315 | Tragic 10.2% |
| Natives/Alaskans | 0.0 /100 | #316 | Tragic 10.2% |
| Irish | 0.0 /100 | #317 | Tragic 10.2% |
| Liberians | 0.0 /100 | #318 | Tragic 10.2% |
Demographics Similar to Immigrants from Congo by Unemployment Among Seniors over 75 years
In terms of unemployment among seniors over 75 years, the demographic groups most similar to Immigrants from Congo are Comanche (6.7%, a difference of 0.81%), Immigrants from Grenada (6.7%, a difference of 0.94%), Yuman (6.7%, a difference of 1.0%), Ute (6.8%, a difference of 1.1%), and Soviet Union (6.6%, a difference of 1.3%).
| Demographics | Rating | Rank | Unemployment Among Seniors over 75 years |
| Immigrants | Armenia | 100.0 /100 | #6 | Exceptional 6.5% |
| Spanish American Indians | 100.0 /100 | #7 | Exceptional 6.5% |
| Taiwanese | 100.0 /100 | #8 | Exceptional 6.6% |
| Soviet Union | 100.0 /100 | #9 | Exceptional 6.6% |
| Yuman | 100.0 /100 | #10 | Exceptional 6.7% |
| Immigrants | Grenada | 100.0 /100 | #11 | Exceptional 6.7% |
| Comanche | 100.0 /100 | #12 | Exceptional 6.7% |
| Immigrants | Congo | 100.0 /100 | #13 | Exceptional 6.7% |
| Ute | 100.0 /100 | #14 | Exceptional 6.8% |
| Icelanders | 100.0 /100 | #15 | Exceptional 7.0% |
| Seminole | 100.0 /100 | #16 | Exceptional 7.1% |
| Immigrants | Switzerland | 100.0 /100 | #17 | Exceptional 7.2% |
| Immigrants | Uzbekistan | 100.0 /100 | #18 | Exceptional 7.2% |
| Immigrants | Zaire | 100.0 /100 | #19 | Exceptional 7.2% |
| Armenians | 100.0 /100 | #20 | Exceptional 7.2% |