Scandinavian vs Tlingit-Haida Poverty
COMPARE
Scandinavian
Tlingit-Haida
Poverty
Poverty Comparison
Scandinavians
Tlingit-Haida
11.1%
POVERTY
98.2/ 100
METRIC RATING
57th/ 347
METRIC RANK
11.7%
POVERTY
89.0/ 100
METRIC RATING
119th/ 347
METRIC RANK
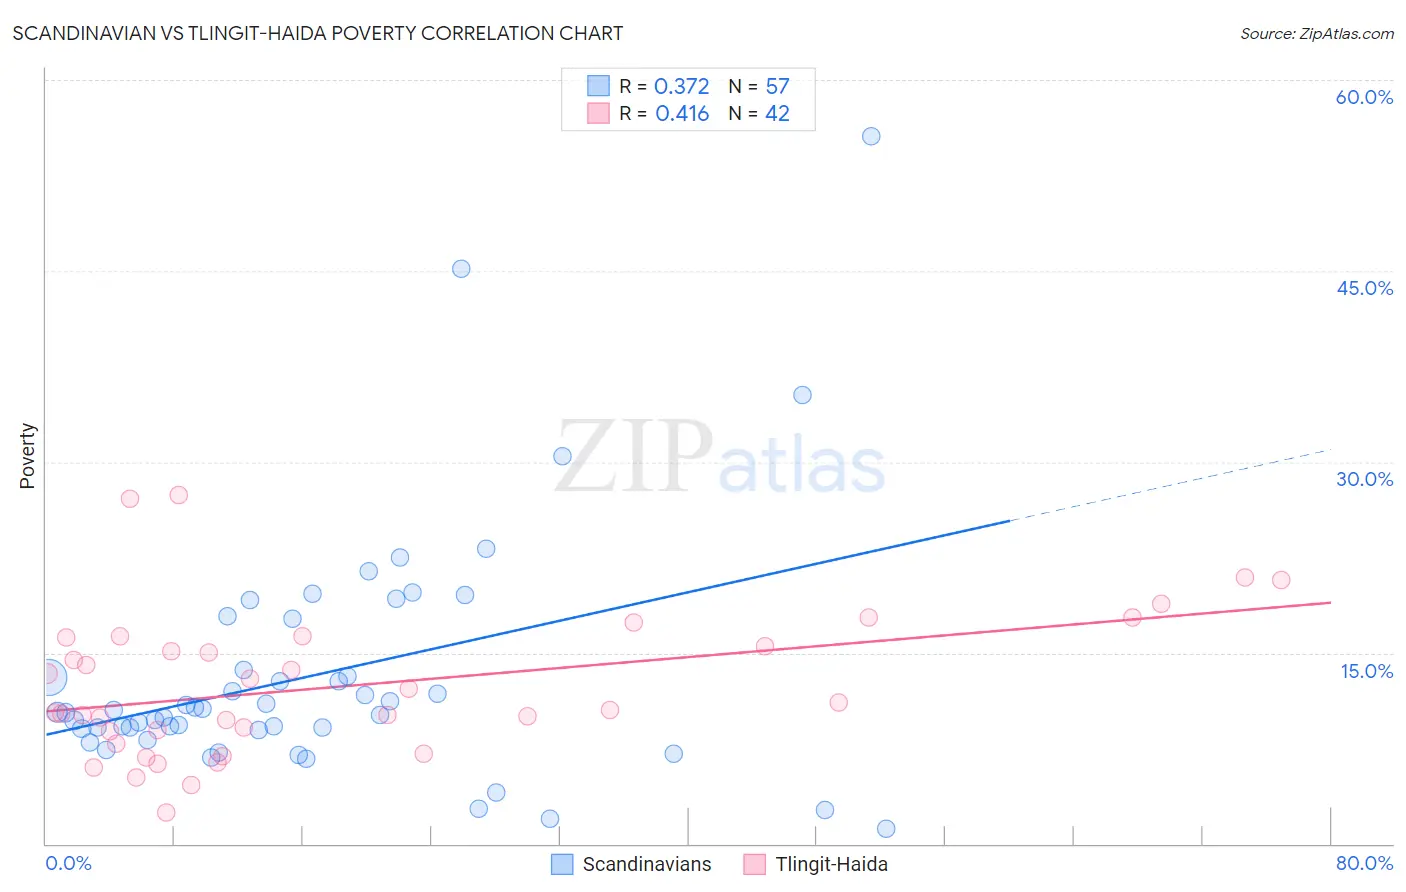
Scandinavian vs Tlingit-Haida Poverty Correlation Chart
The statistical analysis conducted on geographies consisting of 472,236,083 people shows a mild positive correlation between the proportion of Scandinavians and poverty level in the United States with a correlation coefficient (R) of 0.372 and weighted average of 11.1%. Similarly, the statistical analysis conducted on geographies consisting of 60,855,126 people shows a moderate positive correlation between the proportion of Tlingit-Haida and poverty level in the United States with a correlation coefficient (R) of 0.416 and weighted average of 11.7%, a difference of 5.1%.
Poverty Correlation Summary
| Measurement | Scandinavian | Tlingit-Haida |
| Minimum | 1.1% | 2.5% |
| Maximum | 55.6% | 27.4% |
| Range | 54.4% | 24.9% |
| Mean | 13.2% | 12.4% |
| Median | 10.3% | 10.8% |
| Interquartile 25% (IQ1) | 9.0% | 8.9% |
| Interquartile 75% (IQ3) | 15.7% | 16.2% |
| Interquartile Range (IQR) | 6.7% | 7.3% |
| Standard Deviation (Sample) | 9.6% | 5.6% |
| Standard Deviation (Population) | 9.6% | 5.6% |
Similar Demographics by Poverty
Demographics Similar to Scandinavians by Poverty
In terms of poverty, the demographic groups most similar to Scandinavians are Estonian (11.1%, a difference of 0.040%), German (11.1%, a difference of 0.060%), Immigrants from Europe (11.2%, a difference of 0.21%), Immigrants from Sri Lanka (11.2%, a difference of 0.37%), and Immigrants from Italy (11.2%, a difference of 0.44%).
| Demographics | Rating | Rank | Poverty |
| Asians | 98.9 /100 | #50 | Exceptional 11.0% |
| Immigrants | Croatia | 98.7 /100 | #51 | Exceptional 11.0% |
| Immigrants | Philippines | 98.7 /100 | #52 | Exceptional 11.0% |
| Immigrants | Austria | 98.6 /100 | #53 | Exceptional 11.1% |
| Immigrants | Bulgaria | 98.5 /100 | #54 | Exceptional 11.1% |
| Immigrants | Serbia | 98.5 /100 | #55 | Exceptional 11.1% |
| Estonians | 98.2 /100 | #56 | Exceptional 11.1% |
| Scandinavians | 98.2 /100 | #57 | Exceptional 11.1% |
| Germans | 98.1 /100 | #58 | Exceptional 11.1% |
| Immigrants | Europe | 98.0 /100 | #59 | Exceptional 11.2% |
| Immigrants | Sri Lanka | 97.9 /100 | #60 | Exceptional 11.2% |
| Immigrants | Italy | 97.9 /100 | #61 | Exceptional 11.2% |
| Austrians | 97.8 /100 | #62 | Exceptional 11.2% |
| Ukrainians | 97.8 /100 | #63 | Exceptional 11.2% |
| Swiss | 97.7 /100 | #64 | Exceptional 11.2% |
Demographics Similar to Tlingit-Haida by Poverty
In terms of poverty, the demographic groups most similar to Tlingit-Haida are Immigrants from South Eastern Asia (11.7%, a difference of 0.010%), Argentinean (11.7%, a difference of 0.040%), New Zealander (11.7%, a difference of 0.070%), Puget Sound Salish (11.7%, a difference of 0.070%), and Immigrants from Hungary (11.7%, a difference of 0.090%).
| Demographics | Rating | Rank | Poverty |
| Immigrants | Southern Europe | 90.8 /100 | #112 | Exceptional 11.6% |
| Immigrants | Belarus | 90.8 /100 | #113 | Exceptional 11.6% |
| Immigrants | China | 90.7 /100 | #114 | Exceptional 11.6% |
| Albanians | 90.3 /100 | #115 | Exceptional 11.7% |
| Immigrants | Russia | 89.7 /100 | #116 | Excellent 11.7% |
| Sri Lankans | 89.4 /100 | #117 | Excellent 11.7% |
| Argentineans | 89.1 /100 | #118 | Excellent 11.7% |
| Tlingit-Haida | 89.0 /100 | #119 | Excellent 11.7% |
| Immigrants | South Eastern Asia | 88.9 /100 | #120 | Excellent 11.7% |
| New Zealanders | 88.7 /100 | #121 | Excellent 11.7% |
| Puget Sound Salish | 88.7 /100 | #122 | Excellent 11.7% |
| Immigrants | Hungary | 88.6 /100 | #123 | Excellent 11.7% |
| Soviet Union | 88.4 /100 | #124 | Excellent 11.7% |
| Immigrants | Brazil | 88.2 /100 | #125 | Excellent 11.7% |
| Immigrants | Norway | 88.0 /100 | #126 | Excellent 11.7% |