Scotch-Irish vs Tlingit-Haida Unemployment Among Ages 25 to 29 years
COMPARE
Scotch-Irish
Tlingit-Haida
Unemployment Among Ages 25 to 29 years
Unemployment Among Ages 25 to 29 years Comparison
Scotch-Irish
Tlingit-Haida
6.8%
UNEMPLOYMENT AMONG AGES 25 TO 29 YEARS
20.0/ 100
METRIC RATING
204th/ 347
METRIC RANK
8.7%
UNEMPLOYMENT AMONG AGES 25 TO 29 YEARS
0.0/ 100
METRIC RATING
322nd/ 347
METRIC RANK
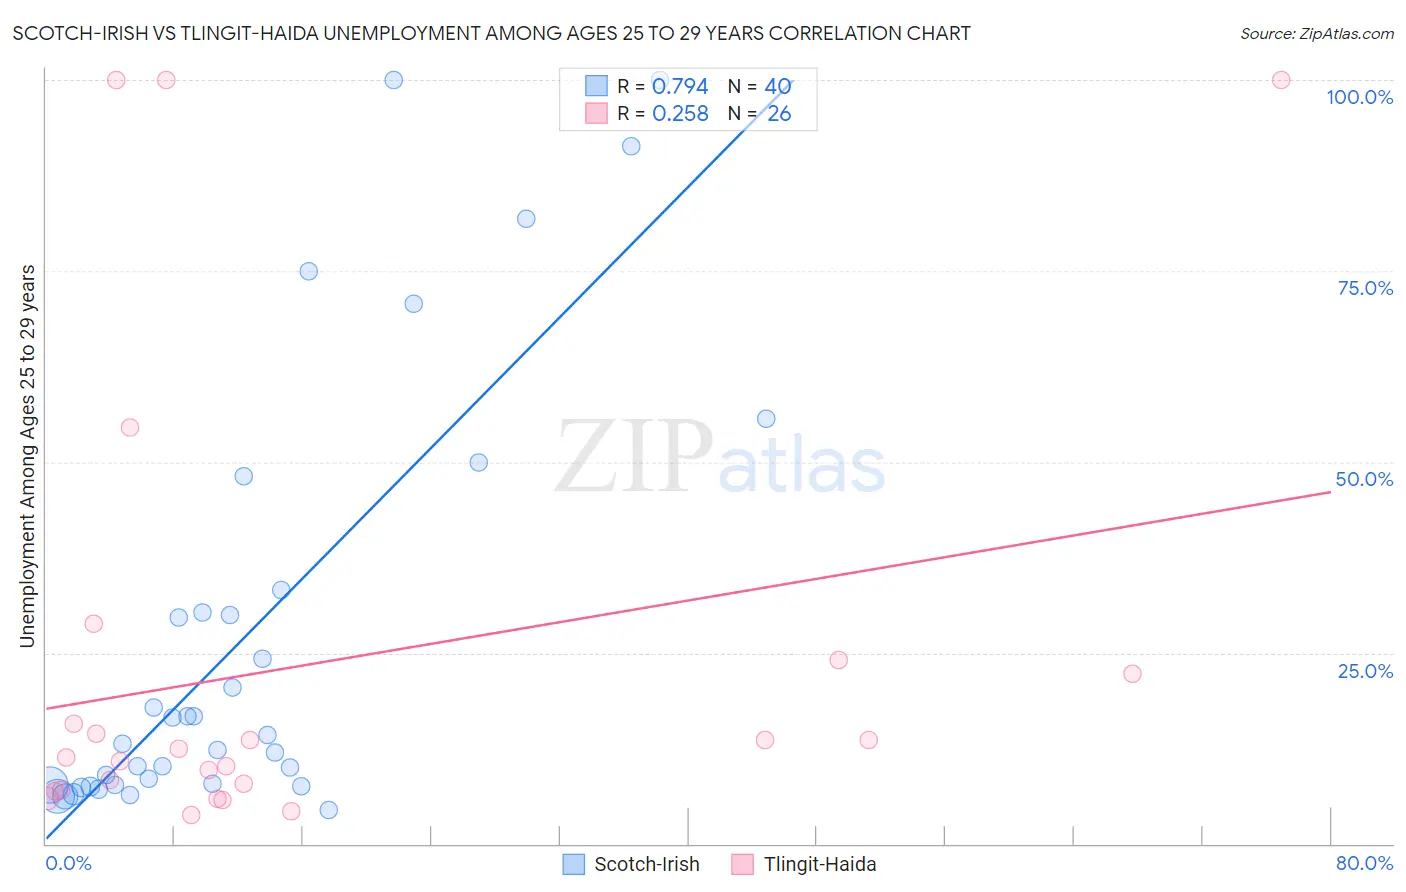
Scotch-Irish vs Tlingit-Haida Unemployment Among Ages 25 to 29 years Correlation Chart
The statistical analysis conducted on geographies consisting of 489,887,362 people shows a strong positive correlation between the proportion of Scotch-Irish and unemployment rate among population between the ages 25 and 29 in the United States with a correlation coefficient (R) of 0.794 and weighted average of 6.8%. Similarly, the statistical analysis conducted on geographies consisting of 59,716,072 people shows a weak positive correlation between the proportion of Tlingit-Haida and unemployment rate among population between the ages 25 and 29 in the United States with a correlation coefficient (R) of 0.258 and weighted average of 8.7%, a difference of 27.8%.
Unemployment Among Ages 25 to 29 years Correlation Summary
| Measurement | Scotch-Irish | Tlingit-Haida |
| Minimum | 4.5% | 3.8% |
| Maximum | 100.0% | 100.0% |
| Range | 95.5% | 96.2% |
| Mean | 27.2% | 23.5% |
| Median | 13.7% | 11.9% |
| Interquartile 25% (IQ1) | 7.7% | 7.0% |
| Interquartile 75% (IQ3) | 31.8% | 22.2% |
| Interquartile Range (IQR) | 24.1% | 15.2% |
| Standard Deviation (Sample) | 28.4% | 30.0% |
| Standard Deviation (Population) | 28.1% | 29.4% |
Similar Demographics by Unemployment Among Ages 25 to 29 years
Demographics Similar to Scotch-Irish by Unemployment Among Ages 25 to 29 years
In terms of unemployment among ages 25 to 29 years, the demographic groups most similar to Scotch-Irish are Immigrants from England (6.8%, a difference of 0.010%), Ugandan (6.8%, a difference of 0.020%), Immigrants from Denmark (6.8%, a difference of 0.090%), Immigrants from Germany (6.8%, a difference of 0.11%), and Immigrants from Norway (6.8%, a difference of 0.12%).
| Demographics | Rating | Rank | Unemployment Among Ages 25 to 29 years |
| Italians | 26.5 /100 | #197 | Fair 6.8% |
| Immigrants | Southern Europe | 24.6 /100 | #198 | Fair 6.8% |
| Guamanians/Chamorros | 24.3 /100 | #199 | Fair 6.8% |
| South American Indians | 23.3 /100 | #200 | Fair 6.8% |
| Basques | 22.5 /100 | #201 | Fair 6.8% |
| Immigrants | Argentina | 21.6 /100 | #202 | Fair 6.8% |
| Immigrants | Norway | 21.2 /100 | #203 | Fair 6.8% |
| Scotch-Irish | 20.0 /100 | #204 | Poor 6.8% |
| Immigrants | England | 19.8 /100 | #205 | Poor 6.8% |
| Ugandans | 19.8 /100 | #206 | Poor 6.8% |
| Immigrants | Denmark | 19.0 /100 | #207 | Poor 6.8% |
| Immigrants | Germany | 18.8 /100 | #208 | Poor 6.8% |
| Hawaiians | 17.1 /100 | #209 | Poor 6.8% |
| Canadians | 16.9 /100 | #210 | Poor 6.8% |
| Immigrants | Philippines | 16.7 /100 | #211 | Poor 6.8% |
Demographics Similar to Tlingit-Haida by Unemployment Among Ages 25 to 29 years
In terms of unemployment among ages 25 to 29 years, the demographic groups most similar to Tlingit-Haida are Dominican (8.7%, a difference of 0.10%), Houma (8.7%, a difference of 0.45%), Immigrants from Dominican Republic (8.6%, a difference of 0.78%), Yakama (8.8%, a difference of 0.96%), and Black/African American (8.6%, a difference of 1.4%).
| Demographics | Rating | Rank | Unemployment Among Ages 25 to 29 years |
| British West Indians | 0.0 /100 | #315 | Tragic 8.4% |
| Immigrants | Grenada | 0.0 /100 | #316 | Tragic 8.4% |
| Immigrants | Guyana | 0.0 /100 | #317 | Tragic 8.5% |
| Guyanese | 0.0 /100 | #318 | Tragic 8.5% |
| Immigrants | Armenia | 0.0 /100 | #319 | Tragic 8.5% |
| Blacks/African Americans | 0.0 /100 | #320 | Tragic 8.6% |
| Immigrants | Dominican Republic | 0.0 /100 | #321 | Tragic 8.6% |
| Tlingit-Haida | 0.0 /100 | #322 | Tragic 8.7% |
| Dominicans | 0.0 /100 | #323 | Tragic 8.7% |
| Houma | 0.0 /100 | #324 | Tragic 8.7% |
| Yakama | 0.0 /100 | #325 | Tragic 8.8% |
| Shoshone | 0.0 /100 | #326 | Tragic 9.2% |
| Colville | 0.0 /100 | #327 | Tragic 9.2% |
| Apache | 0.0 /100 | #328 | Tragic 9.5% |
| Aleuts | 0.0 /100 | #329 | Tragic 9.7% |