Vietnamese vs Tlingit-Haida Poverty
COMPARE
Vietnamese
Tlingit-Haida
Poverty
Poverty Comparison
Vietnamese
Tlingit-Haida
15.0%
POVERTY
0.0/ 100
METRIC RATING
285th/ 347
METRIC RANK
11.7%
POVERTY
89.0/ 100
METRIC RATING
119th/ 347
METRIC RANK
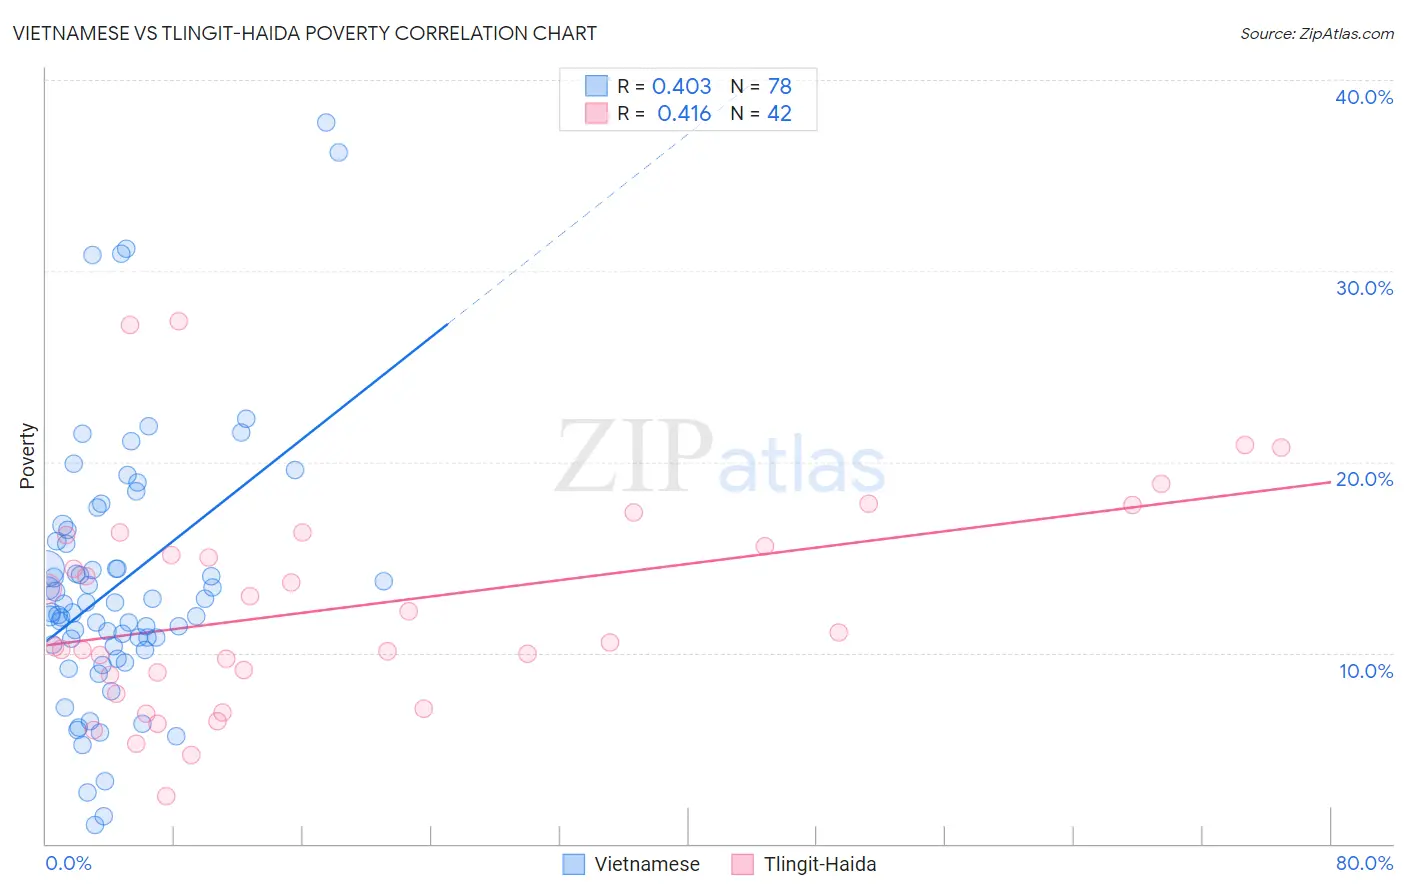
Vietnamese vs Tlingit-Haida Poverty Correlation Chart
The statistical analysis conducted on geographies consisting of 170,677,568 people shows a moderate positive correlation between the proportion of Vietnamese and poverty level in the United States with a correlation coefficient (R) of 0.403 and weighted average of 15.0%. Similarly, the statistical analysis conducted on geographies consisting of 60,855,126 people shows a moderate positive correlation between the proportion of Tlingit-Haida and poverty level in the United States with a correlation coefficient (R) of 0.416 and weighted average of 11.7%, a difference of 28.2%.
Poverty Correlation Summary
| Measurement | Vietnamese | Tlingit-Haida |
| Minimum | 1.0% | 2.5% |
| Maximum | 37.7% | 27.4% |
| Range | 36.7% | 24.9% |
| Mean | 13.6% | 12.4% |
| Median | 12.3% | 10.8% |
| Interquartile 25% (IQ1) | 10.4% | 8.9% |
| Interquartile 75% (IQ3) | 15.9% | 16.2% |
| Interquartile Range (IQR) | 5.5% | 7.3% |
| Standard Deviation (Sample) | 7.0% | 5.6% |
| Standard Deviation (Population) | 7.0% | 5.6% |
Similar Demographics by Poverty
Demographics Similar to Vietnamese by Poverty
In terms of poverty, the demographic groups most similar to Vietnamese are West Indian (15.0%, a difference of 0.050%), Immigrants from Haiti (15.0%, a difference of 0.16%), Immigrants from Latin America (15.0%, a difference of 0.26%), Comanche (15.0%, a difference of 0.28%), and Inupiat (15.1%, a difference of 0.47%).
| Demographics | Rating | Rank | Poverty |
| Belizeans | 0.0 /100 | #278 | Tragic 14.8% |
| Immigrants | St. Vincent and the Grenadines | 0.0 /100 | #279 | Tragic 14.9% |
| Haitians | 0.0 /100 | #280 | Tragic 14.9% |
| Immigrants | Barbados | 0.0 /100 | #281 | Tragic 14.9% |
| Comanche | 0.0 /100 | #282 | Tragic 15.0% |
| Immigrants | Haiti | 0.0 /100 | #283 | Tragic 15.0% |
| West Indians | 0.0 /100 | #284 | Tragic 15.0% |
| Vietnamese | 0.0 /100 | #285 | Tragic 15.0% |
| Immigrants | Latin America | 0.0 /100 | #286 | Tragic 15.0% |
| Inupiat | 0.0 /100 | #287 | Tragic 15.1% |
| Yaqui | 0.0 /100 | #288 | Tragic 15.1% |
| Immigrants | Belize | 0.0 /100 | #289 | Tragic 15.1% |
| Mexicans | 0.0 /100 | #290 | Tragic 15.1% |
| Immigrants | Cabo Verde | 0.0 /100 | #291 | Tragic 15.1% |
| Indonesians | 0.0 /100 | #292 | Tragic 15.1% |
Demographics Similar to Tlingit-Haida by Poverty
In terms of poverty, the demographic groups most similar to Tlingit-Haida are Immigrants from South Eastern Asia (11.7%, a difference of 0.010%), Argentinean (11.7%, a difference of 0.040%), New Zealander (11.7%, a difference of 0.070%), Puget Sound Salish (11.7%, a difference of 0.070%), and Immigrants from Hungary (11.7%, a difference of 0.090%).
| Demographics | Rating | Rank | Poverty |
| Immigrants | Southern Europe | 90.8 /100 | #112 | Exceptional 11.6% |
| Immigrants | Belarus | 90.8 /100 | #113 | Exceptional 11.6% |
| Immigrants | China | 90.7 /100 | #114 | Exceptional 11.6% |
| Albanians | 90.3 /100 | #115 | Exceptional 11.7% |
| Immigrants | Russia | 89.7 /100 | #116 | Excellent 11.7% |
| Sri Lankans | 89.4 /100 | #117 | Excellent 11.7% |
| Argentineans | 89.1 /100 | #118 | Excellent 11.7% |
| Tlingit-Haida | 89.0 /100 | #119 | Excellent 11.7% |
| Immigrants | South Eastern Asia | 88.9 /100 | #120 | Excellent 11.7% |
| New Zealanders | 88.7 /100 | #121 | Excellent 11.7% |
| Puget Sound Salish | 88.7 /100 | #122 | Excellent 11.7% |
| Immigrants | Hungary | 88.6 /100 | #123 | Excellent 11.7% |
| Soviet Union | 88.4 /100 | #124 | Excellent 11.7% |
| Immigrants | Brazil | 88.2 /100 | #125 | Excellent 11.7% |
| Immigrants | Norway | 88.0 /100 | #126 | Excellent 11.7% |