Immigrants from Australia vs Arab Poverty
COMPARE
Immigrants from Australia
Arab
Poverty
Poverty Comparison
Immigrants from Australia
Arabs
11.2%
POVERTY
97.4/ 100
METRIC RATING
67th/ 347
METRIC RANK
12.7%
POVERTY
21.1/ 100
METRIC RATING
194th/ 347
METRIC RANK
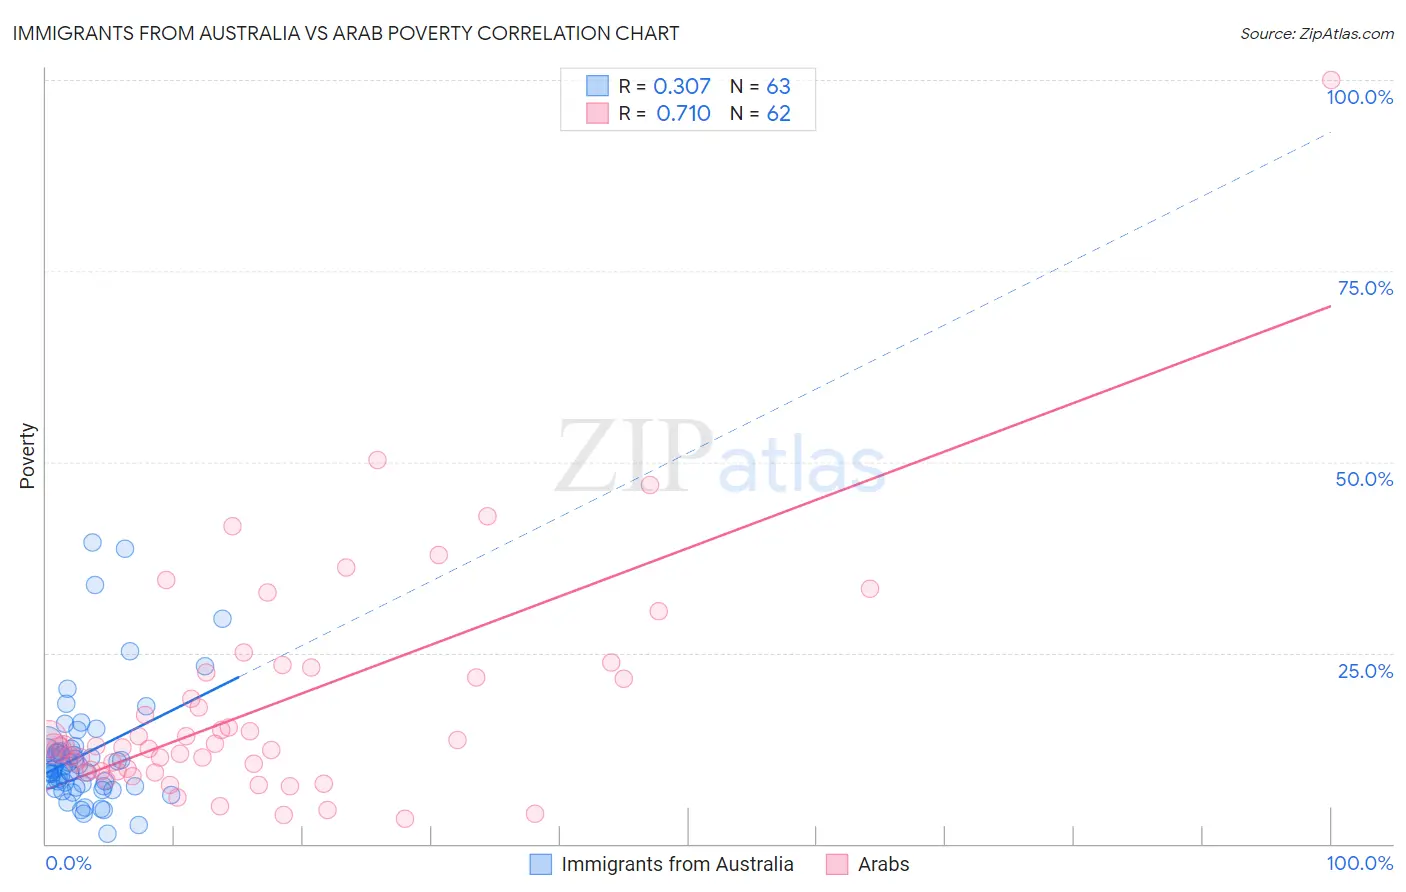
Immigrants from Australia vs Arab Poverty Correlation Chart
The statistical analysis conducted on geographies consisting of 227,147,878 people shows a mild positive correlation between the proportion of Immigrants from Australia and poverty level in the United States with a correlation coefficient (R) of 0.307 and weighted average of 11.2%. Similarly, the statistical analysis conducted on geographies consisting of 486,388,677 people shows a strong positive correlation between the proportion of Arabs and poverty level in the United States with a correlation coefficient (R) of 0.710 and weighted average of 12.7%, a difference of 13.2%.
Poverty Correlation Summary
| Measurement | Immigrants from Australia | Arab |
| Minimum | 1.4% | 3.3% |
| Maximum | 39.4% | 100.0% |
| Range | 38.1% | 96.7% |
| Mean | 11.8% | 18.1% |
| Median | 9.9% | 12.7% |
| Interquartile 25% (IQ1) | 7.6% | 9.5% |
| Interquartile 75% (IQ3) | 12.5% | 22.3% |
| Interquartile Range (IQR) | 4.9% | 12.9% |
| Standard Deviation (Sample) | 7.7% | 15.4% |
| Standard Deviation (Population) | 7.6% | 15.3% |
Similar Demographics by Poverty
Demographics Similar to Immigrants from Australia by Poverty
In terms of poverty, the demographic groups most similar to Immigrants from Australia are Slovak (11.2%, a difference of 0.020%), Immigrants from Netherlands (11.2%, a difference of 0.040%), Serbian (11.2%, a difference of 0.080%), Immigrants from Asia (11.2%, a difference of 0.11%), and Immigrants from Canada (11.3%, a difference of 0.17%).
| Demographics | Rating | Rank | Poverty |
| Immigrants | Sri Lanka | 97.9 /100 | #60 | Exceptional 11.2% |
| Immigrants | Italy | 97.9 /100 | #61 | Exceptional 11.2% |
| Austrians | 97.8 /100 | #62 | Exceptional 11.2% |
| Ukrainians | 97.8 /100 | #63 | Exceptional 11.2% |
| Swiss | 97.7 /100 | #64 | Exceptional 11.2% |
| Immigrants | Asia | 97.5 /100 | #65 | Exceptional 11.2% |
| Immigrants | Netherlands | 97.5 /100 | #66 | Exceptional 11.2% |
| Immigrants | Australia | 97.4 /100 | #67 | Exceptional 11.2% |
| Slovaks | 97.4 /100 | #68 | Exceptional 11.2% |
| Serbians | 97.4 /100 | #69 | Exceptional 11.2% |
| Immigrants | Canada | 97.3 /100 | #70 | Exceptional 11.3% |
| Zimbabweans | 97.3 /100 | #71 | Exceptional 11.3% |
| Europeans | 97.2 /100 | #72 | Exceptional 11.3% |
| Immigrants | Belgium | 97.2 /100 | #73 | Exceptional 11.3% |
| Carpatho Rusyns | 97.2 /100 | #74 | Exceptional 11.3% |
Demographics Similar to Arabs by Poverty
In terms of poverty, the demographic groups most similar to Arabs are Immigrants from Kuwait (12.7%, a difference of 0.030%), Delaware (12.7%, a difference of 0.040%), Iraqi (12.7%, a difference of 0.050%), South American Indian (12.7%, a difference of 0.29%), and Immigrants from Lebanon (12.8%, a difference of 0.36%).
| Demographics | Rating | Rank | Poverty |
| Hawaiians | 34.1 /100 | #187 | Fair 12.5% |
| Immigrants | Costa Rica | 33.3 /100 | #188 | Fair 12.5% |
| Aleuts | 33.2 /100 | #189 | Fair 12.5% |
| Immigrants | South America | 32.3 /100 | #190 | Fair 12.5% |
| Sierra Leoneans | 31.5 /100 | #191 | Fair 12.6% |
| South American Indians | 23.3 /100 | #192 | Fair 12.7% |
| Delaware | 21.4 /100 | #193 | Fair 12.7% |
| Arabs | 21.1 /100 | #194 | Fair 12.7% |
| Immigrants | Kuwait | 20.9 /100 | #195 | Fair 12.7% |
| Iraqis | 20.8 /100 | #196 | Fair 12.7% |
| Immigrants | Lebanon | 18.7 /100 | #197 | Poor 12.8% |
| Spanish | 18.7 /100 | #198 | Poor 12.8% |
| Immigrants | Kenya | 17.5 /100 | #199 | Poor 12.8% |
| Spaniards | 16.5 /100 | #200 | Poor 12.8% |
| Immigrants | Uganda | 16.5 /100 | #201 | Poor 12.8% |