Hispanic or Latino vs Arab Poverty
COMPARE
Hispanic or Latino
Arab
Poverty
Poverty Comparison
Hispanics or Latinos
Arabs
15.3%
POVERTY
0.0/ 100
METRIC RATING
296th/ 347
METRIC RANK
12.7%
POVERTY
21.1/ 100
METRIC RATING
194th/ 347
METRIC RANK
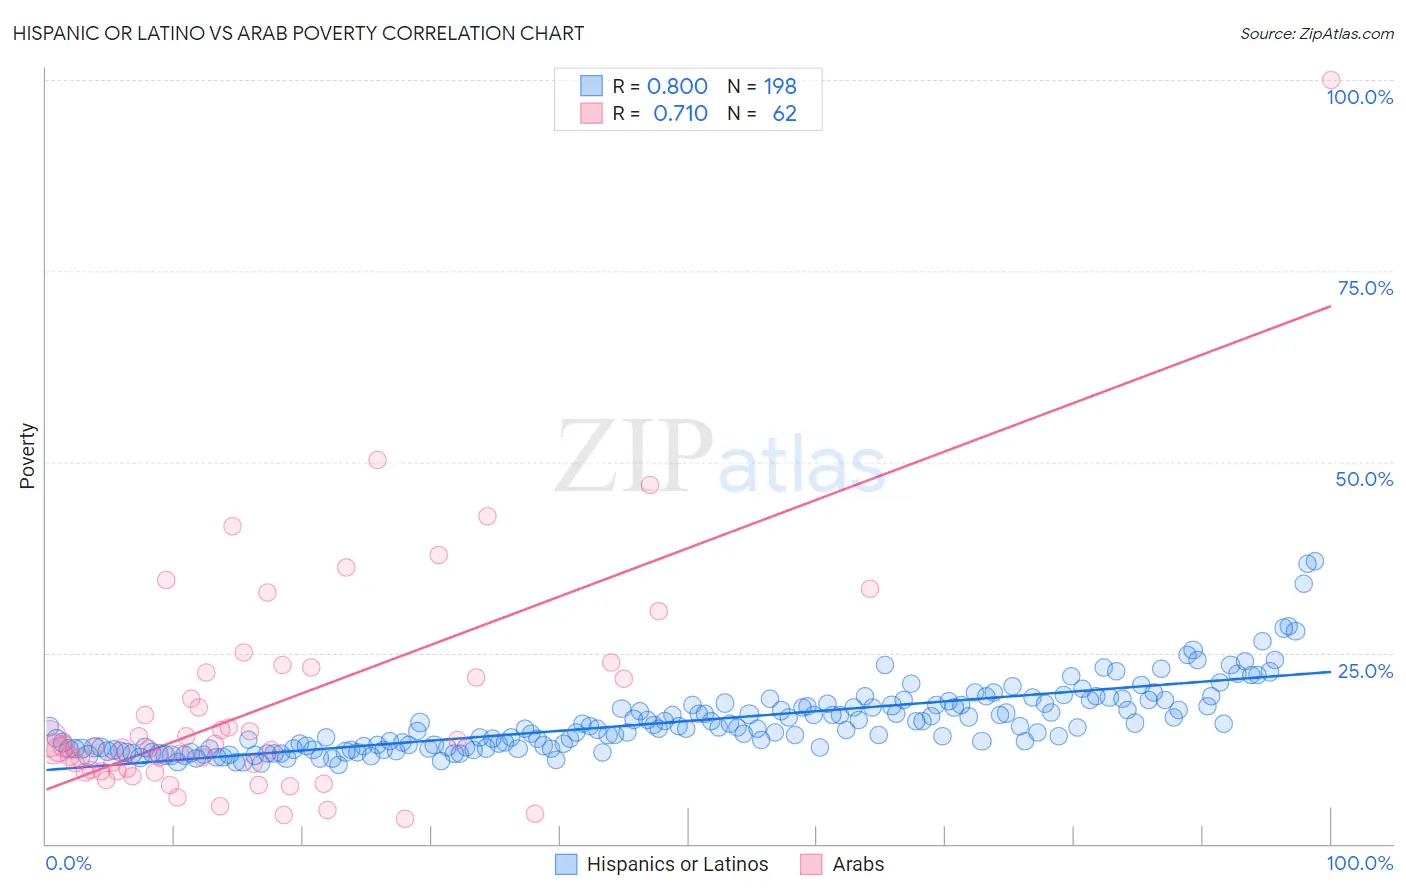
Hispanic or Latino vs Arab Poverty Correlation Chart
The statistical analysis conducted on geographies consisting of 574,490,073 people shows a very strong positive correlation between the proportion of Hispanics or Latinos and poverty level in the United States with a correlation coefficient (R) of 0.800 and weighted average of 15.3%. Similarly, the statistical analysis conducted on geographies consisting of 486,388,677 people shows a strong positive correlation between the proportion of Arabs and poverty level in the United States with a correlation coefficient (R) of 0.710 and weighted average of 12.7%, a difference of 20.1%.
Poverty Correlation Summary
| Measurement | Hispanic or Latino | Arab |
| Minimum | 10.3% | 3.3% |
| Maximum | 37.0% | 100.0% |
| Range | 26.7% | 96.7% |
| Mean | 16.0% | 18.1% |
| Median | 15.1% | 12.7% |
| Interquartile 25% (IQ1) | 12.5% | 9.5% |
| Interquartile 75% (IQ3) | 18.1% | 22.3% |
| Interquartile Range (IQR) | 5.6% | 12.9% |
| Standard Deviation (Sample) | 4.6% | 15.4% |
| Standard Deviation (Population) | 4.6% | 15.3% |
Similar Demographics by Poverty
Demographics Similar to Hispanics or Latinos by Poverty
In terms of poverty, the demographic groups most similar to Hispanics or Latinos are Guatemalan (15.3%, a difference of 0.010%), Immigrants from Bangladesh (15.3%, a difference of 0.050%), Immigrants from Senegal (15.3%, a difference of 0.19%), Senegalese (15.3%, a difference of 0.29%), and Blackfeet (15.2%, a difference of 0.43%).
| Demographics | Rating | Rank | Poverty |
| Immigrants | Belize | 0.0 /100 | #289 | Tragic 15.1% |
| Mexicans | 0.0 /100 | #290 | Tragic 15.1% |
| Immigrants | Cabo Verde | 0.0 /100 | #291 | Tragic 15.1% |
| Indonesians | 0.0 /100 | #292 | Tragic 15.1% |
| Immigrants | Zaire | 0.0 /100 | #293 | Tragic 15.1% |
| Blackfeet | 0.0 /100 | #294 | Tragic 15.2% |
| Guatemalans | 0.0 /100 | #295 | Tragic 15.3% |
| Hispanics or Latinos | 0.0 /100 | #296 | Tragic 15.3% |
| Immigrants | Bangladesh | 0.0 /100 | #297 | Tragic 15.3% |
| Immigrants | Senegal | 0.0 /100 | #298 | Tragic 15.3% |
| Senegalese | 0.0 /100 | #299 | Tragic 15.3% |
| Immigrants | Central America | 0.0 /100 | #300 | Tragic 15.4% |
| Bahamians | 0.0 /100 | #301 | Tragic 15.4% |
| Somalis | 0.0 /100 | #302 | Tragic 15.4% |
| Immigrants | Caribbean | 0.0 /100 | #303 | Tragic 15.5% |
Demographics Similar to Arabs by Poverty
In terms of poverty, the demographic groups most similar to Arabs are Immigrants from Kuwait (12.7%, a difference of 0.030%), Delaware (12.7%, a difference of 0.040%), Iraqi (12.7%, a difference of 0.050%), South American Indian (12.7%, a difference of 0.29%), and Immigrants from Lebanon (12.8%, a difference of 0.36%).
| Demographics | Rating | Rank | Poverty |
| Hawaiians | 34.1 /100 | #187 | Fair 12.5% |
| Immigrants | Costa Rica | 33.3 /100 | #188 | Fair 12.5% |
| Aleuts | 33.2 /100 | #189 | Fair 12.5% |
| Immigrants | South America | 32.3 /100 | #190 | Fair 12.5% |
| Sierra Leoneans | 31.5 /100 | #191 | Fair 12.6% |
| South American Indians | 23.3 /100 | #192 | Fair 12.7% |
| Delaware | 21.4 /100 | #193 | Fair 12.7% |
| Arabs | 21.1 /100 | #194 | Fair 12.7% |
| Immigrants | Kuwait | 20.9 /100 | #195 | Fair 12.7% |
| Iraqis | 20.8 /100 | #196 | Fair 12.7% |
| Immigrants | Lebanon | 18.7 /100 | #197 | Poor 12.8% |
| Spanish | 18.7 /100 | #198 | Poor 12.8% |
| Immigrants | Kenya | 17.5 /100 | #199 | Poor 12.8% |
| Spaniards | 16.5 /100 | #200 | Poor 12.8% |
| Immigrants | Uganda | 16.5 /100 | #201 | Poor 12.8% |