Immigrants from Ghana vs Arab Poverty

COMPARE

Immigrants from Ghana
Race
Ancestry
AfghanAfricanAlaska NativeAlaskan AthabascanAlbanianAleutAlsatianAmericanApacheArapahoArgentineanArmenianAssyrian/Chaldean/SyriacAustralianAustrianBahamianBangladeshiBarbadianBasqueBelgianBelizeanBermudanBhutaneseBlackfeetBolivianBrazilianBritishBritish West IndianBulgarianBurmeseCajunCambodianCanadianCape VerdeanCarpatho RusynCelticCentral AmericanCentral American IndianCherokeeCheyenneChickasawChileanChineseChippewaChoctawColombianColvilleComancheCosta RicanCreeCreekCroatianCrowCubanCypriotCzechCzechoslovakianDanishDelawareDominicanDutchDutch West IndianEastern EuropeanEcuadorianEgyptianEnglishEstonianEthiopianEuropeanFijianFilipinoFinnishFrenchFrench American IndianFrench CanadianGermanGerman RussianGhanaianGreekGuamanian/ChamorroGuatemalanGuyaneseHaitianHmongHonduranHopiHoumaHungarianIcelanderIndian (Asian)IndonesianInupiatIranianIraqiIrishIroquoisIsraeliItalianJamaicanJapaneseJordanianKenyanKiowaKoreanLaotianLatvianLebaneseLiberianLithuanianLumbeeLuxembourgerMacedonianMalaysianMalteseMarshalleseMenomineeMexicanMexican American IndianMongolianMoroccanNative HawaiianNavajoNepaleseNew ZealanderNicaraguanNigerianNorthern EuropeanNorwegianOkinawanOsageOttawaPaiutePakistaniPalestinianPanamanianParaguayanPennsylvania GermanPeruvianPimaPolishPortuguesePotawatomiPuebloPuerto RicanPuget Sound SalishRomanianRussianSalvadoranSamoanScandinavianScotch-IrishScottishSeminoleSenegaleseSerbianShoshoneSierra LeoneanSiouxSlavicSlovakSloveneSomaliSouth AfricanSouth AmericanSouth American IndianSoviet UnionSpaniardSpanishSpanish AmericanSpanish American IndianSri LankanSubsaharan AfricanSudaneseSwedishSwissSyrianTaiwaneseThaiTlingit-HaidaTohono O'OdhamTonganTrinidadian and TobagonianTsimshianTurkishU.S. Virgin IslanderUgandanUkrainianUruguayanUteVenezuelanVietnameseWelshWest IndianYakamaYaquiYugoslavianYumanYup'ikZimbabwean
Immigration
NonimmigrantsImmigrantsAfghanistanAfricaAlbaniaArgentinaArmeniaAsiaAustraliaAustriaBahamasBangladeshBarbadosBelarusBelgiumBelizeBoliviaBosnia and HerzegovinaBrazilBulgariaBurma/MyanmarCabo VerdeCambodiaCameroonCanadaCaribbeanCentral AmericaChileChinaColombiaCongoCosta RicaCroatiaCubaCzechoslovakiaDenmarkDominicaDominican RepublicEastern AfricaEastern AsiaEastern EuropeEcuadorEgyptEl SalvadorEnglandEritreaEthiopiaEuropeFijiFranceGermanyGhanaGreeceGrenadaGuatemalaGuyanaHaitiHondurasHong KongHungaryIndiaIndonesiaIranIraqIrelandIsraelItalyJamaicaJapanJordanKazakhstanKenyaKoreaKuwaitLaosLatin AmericaLatviaLebanonLiberiaLithuaniaMalaysiaMexicoMicronesiaMiddle AfricaMoldovaMoroccoNepalNetherlandsNicaraguaNigeriaNorth AmericaNorth MacedoniaNorthern AfricaNorthern EuropeNorwayOceaniaPakistanPanamaPeruPhilippinesPolandPortugalRomaniaRussiaSaudi ArabiaScotlandSenegalSerbiaSierra LeoneSingaporeSomaliaSouth AfricaSouth AmericaSouth Central AsiaSouth Eastern AsiaSouthern EuropeSpainSri LankaSt. Vincent and the GrenadinesSudanSwedenSwitzerlandSyriaTaiwanThailandTrinidad and TobagoTurkeyUgandaUkraineUruguayUzbekistanVenezuelaVietnamWest IndiesWestern AfricaWestern AsiaWestern EuropeYemenZaireZimbabweAzores
Arab
Race
Ancestry
AfghanAfricanAlaska NativeAlaskan AthabascanAlbanianAleutAlsatianAmericanApacheArabArapahoArgentineanArmenianAssyrian/Chaldean/SyriacAustralianAustrianBahamianBangladeshiBarbadianBasqueBelgianBelizeanBermudanBhutaneseBlackfeetBolivianBrazilianBritishBritish West IndianBulgarianBurmeseCajunCambodianCanadianCape VerdeanCarpatho RusynCelticCentral AmericanCentral American IndianCherokeeCheyenneChickasawChileanChineseChippewaChoctawColombianColvilleComancheCosta RicanCreeCreekCroatianCrowCubanCypriotCzechCzechoslovakianDanishDelawareDominicanDutchDutch West IndianEastern EuropeanEcuadorianEgyptianEnglishEstonianEthiopianEuropeanFijianFilipinoFinnishFrenchFrench American IndianFrench CanadianGermanGerman RussianGhanaianGreekGuamanian/ChamorroGuatemalanGuyaneseHaitianHmongHonduranHopiHoumaHungarianIcelanderIndian (Asian)IndonesianInupiatIranianIraqiIrishIroquoisIsraeliItalianJamaicanJapaneseJordanianKenyanKiowaKoreanLaotianLatvianLebaneseLiberianLithuanianLumbeeLuxembourgerMacedonianMalaysianMalteseMarshalleseMenomineeMexicanMexican American IndianMongolianMoroccanNative HawaiianNavajoNepaleseNew ZealanderNicaraguanNigerianNorthern EuropeanNorwegianOkinawanOsageOttawaPaiutePakistaniPalestinianPanamanianParaguayanPennsylvania GermanPeruvianPimaPolishPortuguesePotawatomiPuebloPuerto RicanPuget Sound SalishRomanianRussianSalvadoranSamoanScandinavianScotch-IrishScottishSeminoleSenegaleseSerbianShoshoneSierra LeoneanSiouxSlavicSlovakSloveneSomaliSouth AfricanSouth AmericanSouth American IndianSoviet UnionSpaniardSpanishSpanish AmericanSpanish American IndianSri LankanSubsaharan AfricanSudaneseSwedishSwissSyrianTaiwaneseThaiTlingit-HaidaTohono O'OdhamTonganTrinidadian and TobagonianTsimshianTurkishU.S. Virgin IslanderUgandanUkrainianUruguayanUteVenezuelanVietnameseWelshWest IndianYakamaYaquiYugoslavianYumanYup'ikZimbabwean
Immigration
NonimmigrantsImmigrantsAfghanistanAfricaAlbaniaArgentinaArmeniaAsiaAustraliaAustriaBahamasBangladeshBarbadosBelarusBelgiumBelizeBoliviaBosnia and HerzegovinaBrazilBulgariaBurma/MyanmarCabo VerdeCambodiaCameroonCanadaCaribbeanCentral AmericaChileChinaColombiaCongoCosta RicaCroatiaCubaCzechoslovakiaDenmarkDominicaDominican RepublicEastern AfricaEastern AsiaEastern EuropeEcuadorEgyptEl SalvadorEnglandEritreaEthiopiaEuropeFijiFranceGermanyGreeceGrenadaGuatemalaGuyanaHaitiHondurasHong KongHungaryIndiaIndonesiaIranIraqIrelandIsraelItalyJamaicaJapanJordanKazakhstanKenyaKoreaKuwaitLaosLatin AmericaLatviaLebanonLiberiaLithuaniaMalaysiaMexicoMicronesiaMiddle AfricaMoldovaMoroccoNepalNetherlandsNicaraguaNigeriaNorth AmericaNorth MacedoniaNorthern AfricaNorthern EuropeNorwayOceaniaPakistanPanamaPeruPhilippinesPolandPortugalRomaniaRussiaSaudi ArabiaScotlandSenegalSerbiaSierra LeoneSingaporeSomaliaSouth AfricaSouth AmericaSouth Central AsiaSouth Eastern AsiaSouthern EuropeSpainSri LankaSt. Vincent and the GrenadinesSudanSwedenSwitzerlandSyriaTaiwanThailandTrinidad and TobagoTurkeyUgandaUkraineUruguayUzbekistanVenezuelaVietnamWest IndiesWestern AfricaWestern AsiaWestern EuropeYemenZaireZimbabweAzores
Poverty
Income
Poverty
Unemployment
Labor Participation
Family Structure
Vehicle Availability
Education Level
Disability

Poverty Comparison

Immigrants from Ghana

Arabs

Tragic
Fair
14.2%
POVERTY
0.2/ 100
METRIC RATING
249th/ 347
METRIC RANK
12.7%
POVERTY
21.1/ 100
METRIC RATING
194th/ 347
METRIC RANK

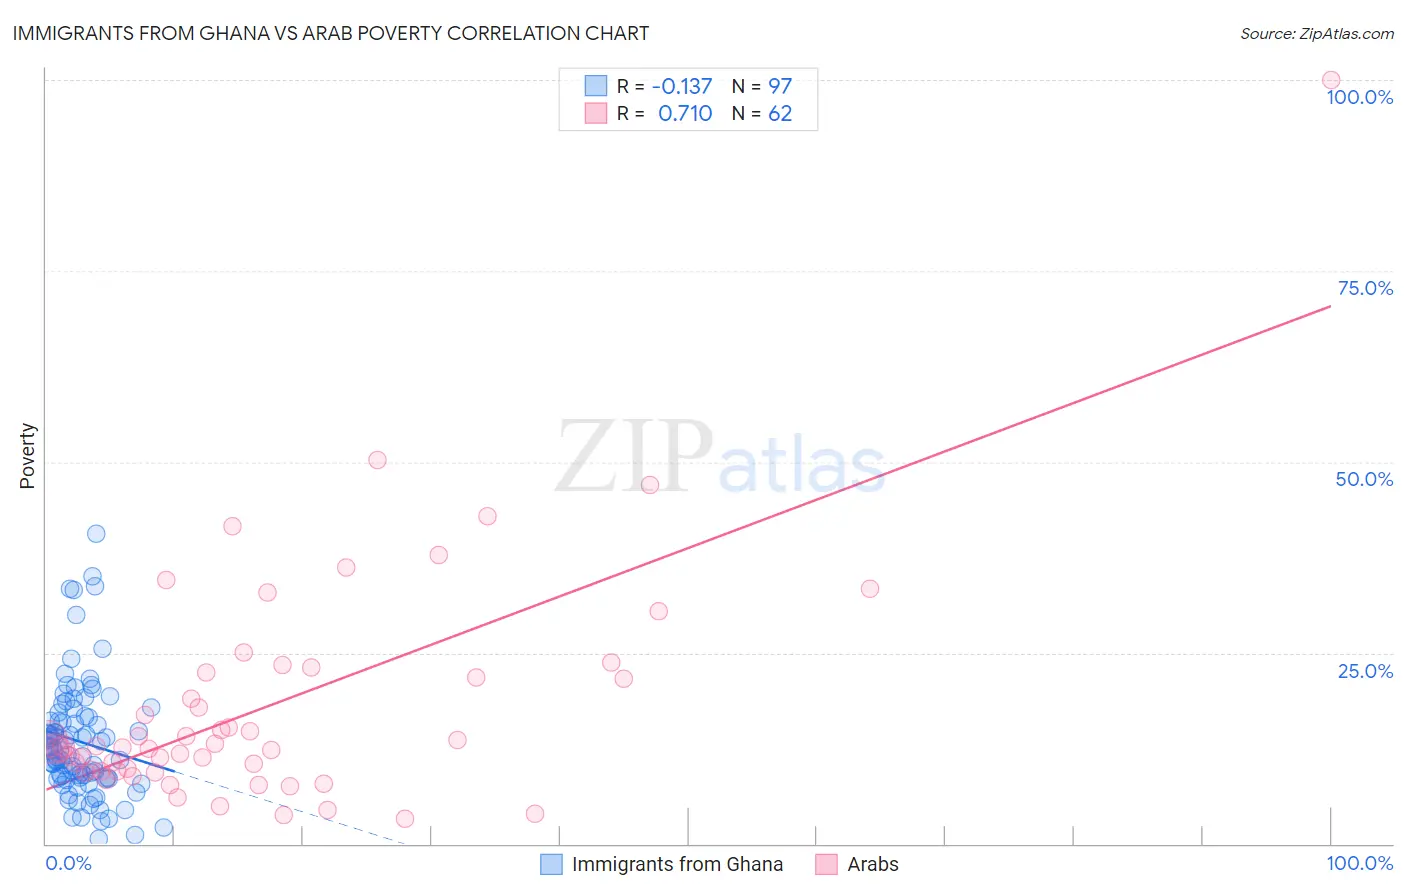
Immigrants from Ghana vs Arab Poverty Correlation Chart

The statistical analysis conducted on geographies consisting of 199,808,032 people shows a poor negative correlation between the proportion of Immigrants from Ghana and poverty level in the United States with a correlation coefficient (R) of -0.137 and weighted average of 14.2%. Similarly, the statistical analysis conducted on geographies consisting of 486,388,677 people shows a strong positive correlation between the proportion of Arabs and poverty level in the United States with a correlation coefficient (R) of 0.710 and weighted average of 12.7%, a difference of 11.4%.
Immigrants from Ghana vs Arab Poverty

Poverty Correlation Summary

MeasurementImmigrants from GhanaArab
Minimum0.71%3.3%
Maximum40.5%100.0%
Range39.8%96.7%
Mean13.4%18.1%
Median12.2%12.7%
Interquartile 25% (IQ1)8.5%9.5%
Interquartile 75% (IQ3)16.6%22.3%
Interquartile Range (IQR)8.1%12.9%
Standard Deviation (Sample)7.6%15.4%
Standard Deviation (Population)7.5%15.3%

Similar Demographics by Poverty

Demographics Similar to Immigrants from Ghana by Poverty

In terms of poverty, the demographic groups most similar to Immigrants from Ghana are Immigrants from Western Africa (14.1%, a difference of 0.090%), Liberian (14.1%, a difference of 0.11%), Cree (14.2%, a difference of 0.30%), Immigrants from Burma/Myanmar (14.2%, a difference of 0.39%), and Potawatomi (14.1%, a difference of 0.40%).
DemographicsRating | RankPoverty
Ecuadorians
0.4
/100
|
#242
Tragic
14.0%
Sudanese
0.3
/100
|
#243
Tragic
14.0%
Nepalese
0.3
/100
|
#244
Tragic
14.0%
Immigrants | Sudan
0.3
/100
|
#245
Tragic
14.1%
Potawatomi
0.3
/100
|
#246
Tragic
14.1%
Liberians
0.2
/100
|
#247
Tragic
14.1%
Immigrants | Western Africa
0.2
/100
|
#248
Tragic
14.1%
Immigrants | Ghana
0.2
/100
|
#249
Tragic
14.2%
Cree
0.2
/100
|
#250
Tragic
14.2%
Immigrants | Burma/Myanmar
0.2
/100
|
#251
Tragic
14.2%
Spanish American Indians
0.2
/100
|
#252
Tragic
14.2%
Immigrants | Trinidad and Tobago
0.2
/100
|
#253
Tragic
14.2%
Immigrants | El Salvador
0.1
/100
|
#254
Tragic
14.3%
Immigrants | Ecuador
0.1
/100
|
#255
Tragic
14.3%
Mexican American Indians
0.1
/100
|
#256
Tragic
14.3%

Demographics Similar to Arabs by Poverty

In terms of poverty, the demographic groups most similar to Arabs are Immigrants from Kuwait (12.7%, a difference of 0.030%), Delaware (12.7%, a difference of 0.040%), Iraqi (12.7%, a difference of 0.050%), South American Indian (12.7%, a difference of 0.29%), and Immigrants from Lebanon (12.8%, a difference of 0.36%).
DemographicsRating | RankPoverty
Hawaiians
34.1
/100
|
#187
Fair
12.5%
Immigrants | Costa Rica
33.3
/100
|
#188
Fair
12.5%
Aleuts
33.2
/100
|
#189
Fair
12.5%
Immigrants | South America
32.3
/100
|
#190
Fair
12.5%
Sierra Leoneans
31.5
/100
|
#191
Fair
12.6%
South American Indians
23.3
/100
|
#192
Fair
12.7%
Delaware
21.4
/100
|
#193
Fair
12.7%
Arabs
21.1
/100
|
#194
Fair
12.7%
Immigrants | Kuwait
20.9
/100
|
#195
Fair
12.7%
Iraqis
20.8
/100
|
#196
Fair
12.7%
Immigrants | Lebanon
18.7
/100
|
#197
Poor
12.8%
Spanish
18.7
/100
|
#198
Poor
12.8%
Immigrants | Kenya
17.5
/100
|
#199
Poor
12.8%
Spaniards
16.5
/100
|
#200
Poor
12.8%
Immigrants | Uganda
16.5
/100
|
#201
Poor
12.8%