Albanian vs Arab Poverty
COMPARE
Albanian
Arab
Poverty
Poverty Comparison
Albanians
Arabs
11.7%
POVERTY
90.3/ 100
METRIC RATING
115th/ 347
METRIC RANK
12.7%
POVERTY
21.1/ 100
METRIC RATING
194th/ 347
METRIC RANK
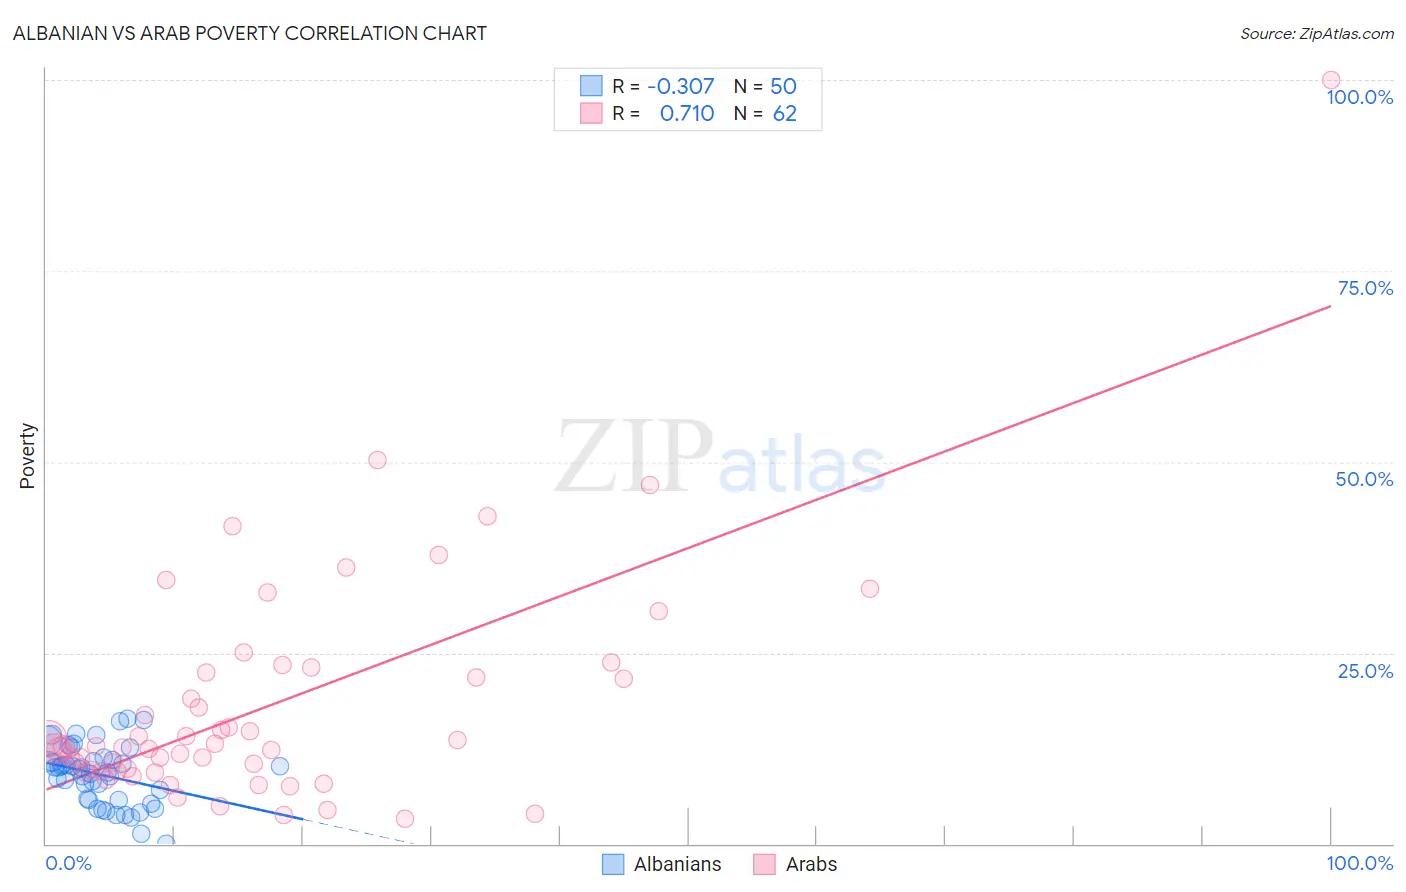
Albanian vs Arab Poverty Correlation Chart
The statistical analysis conducted on geographies consisting of 193,180,317 people shows a mild negative correlation between the proportion of Albanians and poverty level in the United States with a correlation coefficient (R) of -0.307 and weighted average of 11.7%. Similarly, the statistical analysis conducted on geographies consisting of 486,388,677 people shows a strong positive correlation between the proportion of Arabs and poverty level in the United States with a correlation coefficient (R) of 0.710 and weighted average of 12.7%, a difference of 9.1%.
Poverty Correlation Summary
| Measurement | Albanian | Arab |
| Minimum | 0.071% | 3.3% |
| Maximum | 16.4% | 100.0% |
| Range | 16.3% | 96.7% |
| Mean | 9.1% | 18.1% |
| Median | 9.9% | 12.7% |
| Interquartile 25% (IQ1) | 5.8% | 9.5% |
| Interquartile 75% (IQ3) | 11.0% | 22.3% |
| Interquartile Range (IQR) | 5.2% | 12.9% |
| Standard Deviation (Sample) | 3.9% | 15.4% |
| Standard Deviation (Population) | 3.8% | 15.3% |
Similar Demographics by Poverty
Demographics Similar to Albanians by Poverty
In terms of poverty, the demographic groups most similar to Albanians are Immigrants from China (11.6%, a difference of 0.14%), Immigrants from Southern Europe (11.6%, a difference of 0.16%), Immigrants from Belarus (11.6%, a difference of 0.16%), Immigrants from Russia (11.7%, a difference of 0.17%), and French Canadian (11.6%, a difference of 0.23%).
| Demographics | Rating | Rank | Poverty |
| Canadians | 91.7 /100 | #108 | Exceptional 11.6% |
| Immigrants | Turkey | 91.7 /100 | #109 | Exceptional 11.6% |
| Welsh | 91.6 /100 | #110 | Exceptional 11.6% |
| French Canadians | 91.0 /100 | #111 | Exceptional 11.6% |
| Immigrants | Southern Europe | 90.8 /100 | #112 | Exceptional 11.6% |
| Immigrants | Belarus | 90.8 /100 | #113 | Exceptional 11.6% |
| Immigrants | China | 90.7 /100 | #114 | Exceptional 11.6% |
| Albanians | 90.3 /100 | #115 | Exceptional 11.7% |
| Immigrants | Russia | 89.7 /100 | #116 | Excellent 11.7% |
| Sri Lankans | 89.4 /100 | #117 | Excellent 11.7% |
| Argentineans | 89.1 /100 | #118 | Excellent 11.7% |
| Tlingit-Haida | 89.0 /100 | #119 | Excellent 11.7% |
| Immigrants | South Eastern Asia | 88.9 /100 | #120 | Excellent 11.7% |
| New Zealanders | 88.7 /100 | #121 | Excellent 11.7% |
| Puget Sound Salish | 88.7 /100 | #122 | Excellent 11.7% |
Demographics Similar to Arabs by Poverty
In terms of poverty, the demographic groups most similar to Arabs are Immigrants from Kuwait (12.7%, a difference of 0.030%), Delaware (12.7%, a difference of 0.040%), Iraqi (12.7%, a difference of 0.050%), South American Indian (12.7%, a difference of 0.29%), and Immigrants from Lebanon (12.8%, a difference of 0.36%).
| Demographics | Rating | Rank | Poverty |
| Hawaiians | 34.1 /100 | #187 | Fair 12.5% |
| Immigrants | Costa Rica | 33.3 /100 | #188 | Fair 12.5% |
| Aleuts | 33.2 /100 | #189 | Fair 12.5% |
| Immigrants | South America | 32.3 /100 | #190 | Fair 12.5% |
| Sierra Leoneans | 31.5 /100 | #191 | Fair 12.6% |
| South American Indians | 23.3 /100 | #192 | Fair 12.7% |
| Delaware | 21.4 /100 | #193 | Fair 12.7% |
| Arabs | 21.1 /100 | #194 | Fair 12.7% |
| Immigrants | Kuwait | 20.9 /100 | #195 | Fair 12.7% |
| Iraqis | 20.8 /100 | #196 | Fair 12.7% |
| Immigrants | Lebanon | 18.7 /100 | #197 | Poor 12.8% |
| Spanish | 18.7 /100 | #198 | Poor 12.8% |
| Immigrants | Kenya | 17.5 /100 | #199 | Poor 12.8% |
| Spaniards | 16.5 /100 | #200 | Poor 12.8% |
| Immigrants | Uganda | 16.5 /100 | #201 | Poor 12.8% |