Immigrants from Germany vs Paraguayan Family Poverty
COMPARE
Immigrants from Germany
Paraguayan
Family Poverty
Family Poverty Comparison
Immigrants from Germany
Paraguayans
8.5%
FAMILY POVERTY
83.3/ 100
METRIC RATING
143rd/ 347
METRIC RANK
8.3%
FAMILY POVERTY
91.2/ 100
METRIC RATING
122nd/ 347
METRIC RANK
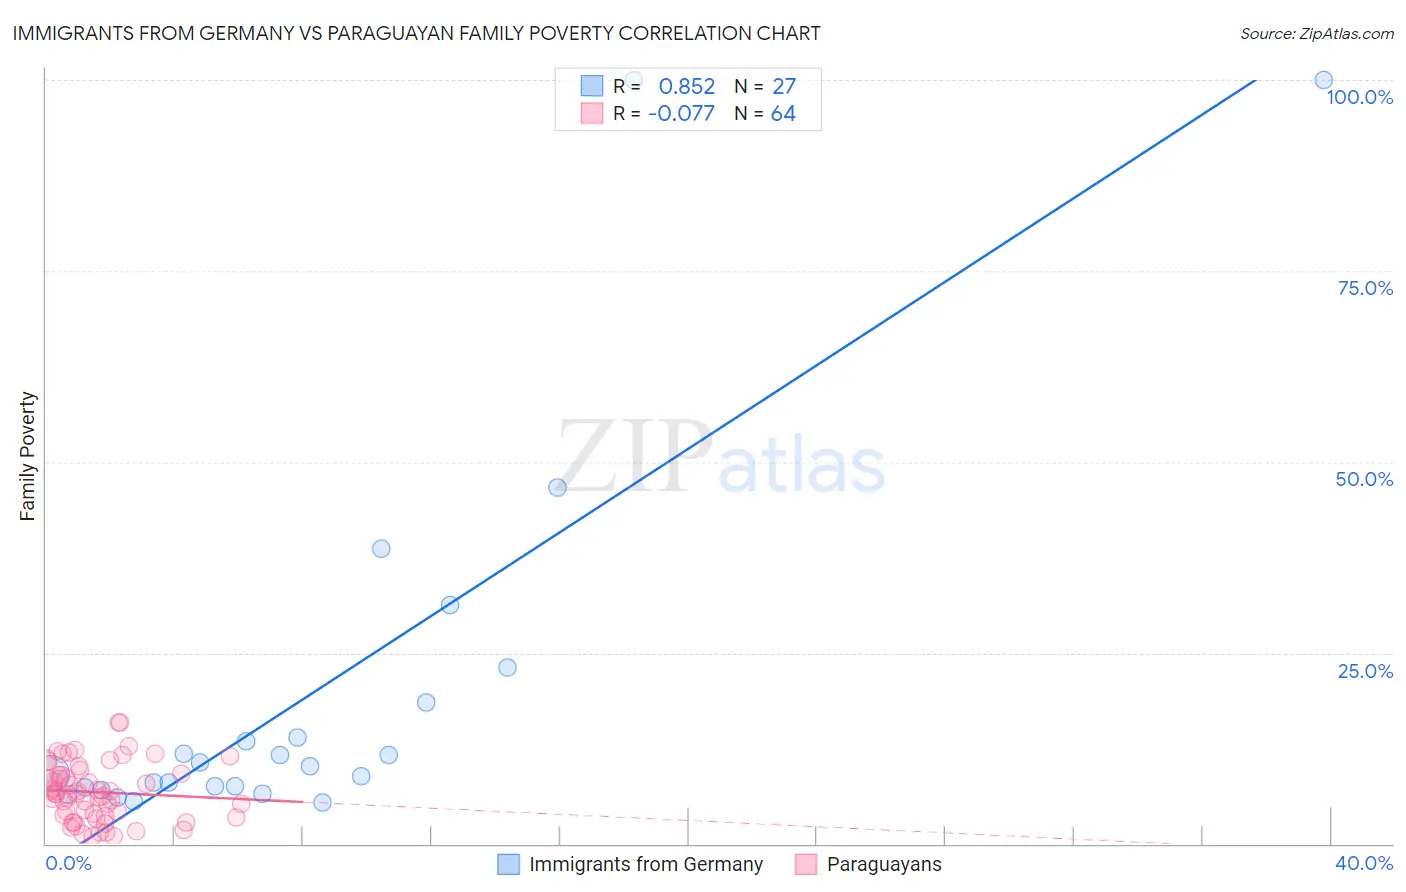
Immigrants from Germany vs Paraguayan Family Poverty Correlation Chart
The statistical analysis conducted on geographies consisting of 462,312,893 people shows a very strong positive correlation between the proportion of Immigrants from Germany and poverty level among families in the United States with a correlation coefficient (R) of 0.852 and weighted average of 8.5%. Similarly, the statistical analysis conducted on geographies consisting of 95,035,993 people shows a slight negative correlation between the proportion of Paraguayans and poverty level among families in the United States with a correlation coefficient (R) of -0.077 and weighted average of 8.3%, a difference of 2.6%.
Family Poverty Correlation Summary
| Measurement | Immigrants from Germany | Paraguayan |
| Minimum | 5.4% | 0.93% |
| Maximum | 100.0% | 16.0% |
| Range | 94.6% | 15.0% |
| Mean | 19.8% | 6.8% |
| Median | 10.2% | 6.6% |
| Interquartile 25% (IQ1) | 7.3% | 3.6% |
| Interquartile 75% (IQ3) | 18.4% | 9.1% |
| Interquartile Range (IQR) | 11.1% | 5.5% |
| Standard Deviation (Sample) | 25.3% | 3.7% |
| Standard Deviation (Population) | 24.8% | 3.7% |
Similar Demographics by Family Poverty
Demographics Similar to Immigrants from Germany by Family Poverty
In terms of family poverty, the demographic groups most similar to Immigrants from Germany are Albanian (8.5%, a difference of 0.020%), Yugoslavian (8.5%, a difference of 0.030%), Immigrants from South Eastern Asia (8.5%, a difference of 0.040%), Immigrants from Belarus (8.5%, a difference of 0.050%), and Immigrants from Jordan (8.5%, a difference of 0.080%).
| Demographics | Rating | Rank | Family Poverty |
| Immigrants | Brazil | 86.3 /100 | #136 | Excellent 8.5% |
| Immigrants | Southern Europe | 86.0 /100 | #137 | Excellent 8.5% |
| Armenians | 84.6 /100 | #138 | Excellent 8.5% |
| Immigrants | Nepal | 84.2 /100 | #139 | Excellent 8.5% |
| Immigrants | Kazakhstan | 84.1 /100 | #140 | Excellent 8.5% |
| Immigrants | Ukraine | 83.9 /100 | #141 | Excellent 8.5% |
| Yugoslavians | 83.5 /100 | #142 | Excellent 8.5% |
| Immigrants | Germany | 83.3 /100 | #143 | Excellent 8.5% |
| Albanians | 83.3 /100 | #144 | Excellent 8.5% |
| Immigrants | South Eastern Asia | 83.2 /100 | #145 | Excellent 8.5% |
| Immigrants | Belarus | 83.2 /100 | #146 | Excellent 8.5% |
| Immigrants | Jordan | 83.0 /100 | #147 | Excellent 8.5% |
| Scotch-Irish | 82.2 /100 | #148 | Excellent 8.6% |
| Mongolians | 80.4 /100 | #149 | Excellent 8.6% |
| Syrians | 80.3 /100 | #150 | Excellent 8.6% |
Demographics Similar to Paraguayans by Family Poverty
In terms of family poverty, the demographic groups most similar to Paraguayans are Native Hawaiian (8.3%, a difference of 0.010%), Palestinian (8.3%, a difference of 0.070%), Soviet Union (8.3%, a difference of 0.17%), Immigrants from Egypt (8.3%, a difference of 0.18%), and Pakistani (8.3%, a difference of 0.21%).
| Demographics | Rating | Rank | Family Poverty |
| Immigrants | Israel | 93.5 /100 | #115 | Exceptional 8.2% |
| South Africans | 93.4 /100 | #116 | Exceptional 8.2% |
| Immigrants | Russia | 93.2 /100 | #117 | Exceptional 8.2% |
| Immigrants | Western Europe | 92.9 /100 | #118 | Exceptional 8.2% |
| French | 92.8 /100 | #119 | Exceptional 8.3% |
| Immigrants | Egypt | 91.6 /100 | #120 | Exceptional 8.3% |
| Native Hawaiians | 91.3 /100 | #121 | Exceptional 8.3% |
| Paraguayans | 91.2 /100 | #122 | Exceptional 8.3% |
| Palestinians | 91.1 /100 | #123 | Exceptional 8.3% |
| Soviet Union | 90.8 /100 | #124 | Exceptional 8.3% |
| Pakistanis | 90.8 /100 | #125 | Exceptional 8.3% |
| Icelanders | 90.3 /100 | #126 | Exceptional 8.3% |
| Immigrants | Hungary | 89.9 /100 | #127 | Excellent 8.4% |
| Argentineans | 89.6 /100 | #128 | Excellent 8.4% |
| Portuguese | 89.2 /100 | #129 | Excellent 8.4% |