U.S. Virgin Islander vs Paraguayan Family Poverty
COMPARE
U.S. Virgin Islander
Paraguayan
Family Poverty
Family Poverty Comparison
U.S. Virgin Islanders
Paraguayans
12.4%
FAMILY POVERTY
0.0/ 100
METRIC RATING
318th/ 347
METRIC RANK
8.3%
FAMILY POVERTY
91.2/ 100
METRIC RATING
122nd/ 347
METRIC RANK
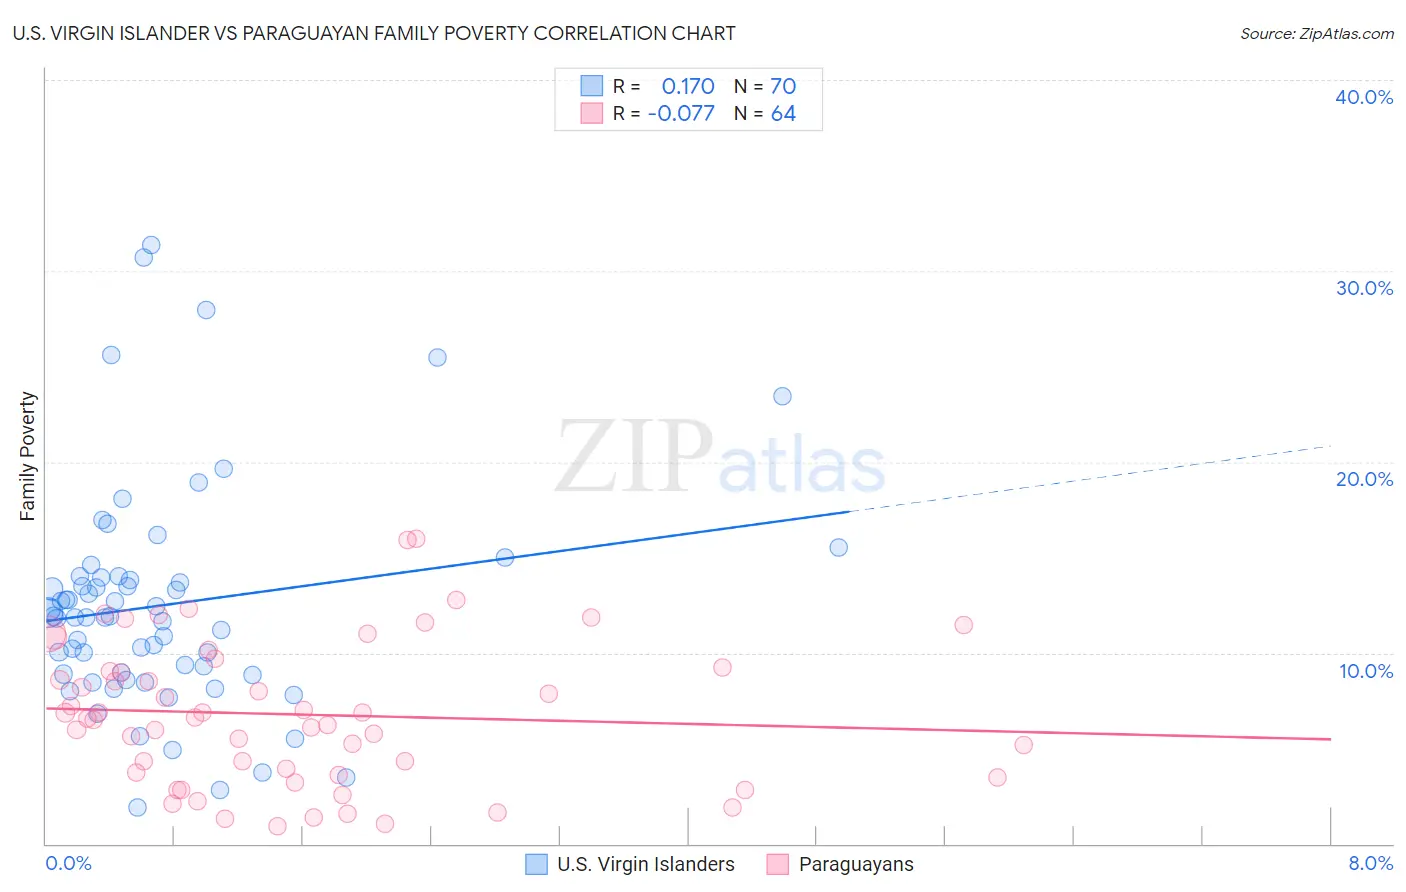
U.S. Virgin Islander vs Paraguayan Family Poverty Correlation Chart
The statistical analysis conducted on geographies consisting of 87,485,330 people shows a poor positive correlation between the proportion of U.S. Virgin Islanders and poverty level among families in the United States with a correlation coefficient (R) of 0.170 and weighted average of 12.4%. Similarly, the statistical analysis conducted on geographies consisting of 95,035,993 people shows a slight negative correlation between the proportion of Paraguayans and poverty level among families in the United States with a correlation coefficient (R) of -0.077 and weighted average of 8.3%, a difference of 49.1%.
Family Poverty Correlation Summary
| Measurement | U.S. Virgin Islander | Paraguayan |
| Minimum | 1.9% | 0.93% |
| Maximum | 31.4% | 16.0% |
| Range | 29.5% | 15.0% |
| Mean | 12.5% | 6.8% |
| Median | 11.9% | 6.6% |
| Interquartile 25% (IQ1) | 8.9% | 3.6% |
| Interquartile 75% (IQ3) | 14.0% | 9.1% |
| Interquartile Range (IQR) | 5.1% | 5.5% |
| Standard Deviation (Sample) | 5.9% | 3.7% |
| Standard Deviation (Population) | 5.9% | 3.7% |
Similar Demographics by Family Poverty
Demographics Similar to U.S. Virgin Islanders by Family Poverty
In terms of family poverty, the demographic groups most similar to U.S. Virgin Islanders are Immigrants from Grenada (12.4%, a difference of 0.010%), British West Indian (12.4%, a difference of 0.050%), Honduran (12.4%, a difference of 0.22%), Inupiat (12.5%, a difference of 0.53%), and Immigrants from Mexico (12.3%, a difference of 0.96%).
| Demographics | Rating | Rank | Family Poverty |
| Ute | 0.0 /100 | #311 | Tragic 12.1% |
| Immigrants | Central America | 0.0 /100 | #312 | Tragic 12.1% |
| Immigrants | Caribbean | 0.0 /100 | #313 | Tragic 12.2% |
| Kiowa | 0.0 /100 | #314 | Tragic 12.2% |
| Immigrants | Mexico | 0.0 /100 | #315 | Tragic 12.3% |
| Hondurans | 0.0 /100 | #316 | Tragic 12.4% |
| Immigrants | Grenada | 0.0 /100 | #317 | Tragic 12.4% |
| U.S. Virgin Islanders | 0.0 /100 | #318 | Tragic 12.4% |
| British West Indians | 0.0 /100 | #319 | Tragic 12.4% |
| Inupiat | 0.0 /100 | #320 | Tragic 12.5% |
| Arapaho | 0.0 /100 | #321 | Tragic 12.7% |
| Immigrants | Honduras | 0.0 /100 | #322 | Tragic 12.7% |
| Menominee | 0.0 /100 | #323 | Tragic 12.7% |
| Immigrants | Dominica | 0.0 /100 | #324 | Tragic 12.7% |
| Paiute | 0.0 /100 | #325 | Tragic 13.0% |
Demographics Similar to Paraguayans by Family Poverty
In terms of family poverty, the demographic groups most similar to Paraguayans are Native Hawaiian (8.3%, a difference of 0.010%), Palestinian (8.3%, a difference of 0.070%), Soviet Union (8.3%, a difference of 0.17%), Immigrants from Egypt (8.3%, a difference of 0.18%), and Pakistani (8.3%, a difference of 0.21%).
| Demographics | Rating | Rank | Family Poverty |
| Immigrants | Israel | 93.5 /100 | #115 | Exceptional 8.2% |
| South Africans | 93.4 /100 | #116 | Exceptional 8.2% |
| Immigrants | Russia | 93.2 /100 | #117 | Exceptional 8.2% |
| Immigrants | Western Europe | 92.9 /100 | #118 | Exceptional 8.2% |
| French | 92.8 /100 | #119 | Exceptional 8.3% |
| Immigrants | Egypt | 91.6 /100 | #120 | Exceptional 8.3% |
| Native Hawaiians | 91.3 /100 | #121 | Exceptional 8.3% |
| Paraguayans | 91.2 /100 | #122 | Exceptional 8.3% |
| Palestinians | 91.1 /100 | #123 | Exceptional 8.3% |
| Soviet Union | 90.8 /100 | #124 | Exceptional 8.3% |
| Pakistanis | 90.8 /100 | #125 | Exceptional 8.3% |
| Icelanders | 90.3 /100 | #126 | Exceptional 8.3% |
| Immigrants | Hungary | 89.9 /100 | #127 | Excellent 8.4% |
| Argentineans | 89.6 /100 | #128 | Excellent 8.4% |
| Portuguese | 89.2 /100 | #129 | Excellent 8.4% |