Immigrants from Cameroon vs Paraguayan Family Poverty
COMPARE
Immigrants from Cameroon
Paraguayan
Family Poverty
Family Poverty Comparison
Immigrants from Cameroon
Paraguayans
9.0%
FAMILY POVERTY
47.1/ 100
METRIC RATING
178th/ 347
METRIC RANK
8.3%
FAMILY POVERTY
91.2/ 100
METRIC RATING
122nd/ 347
METRIC RANK
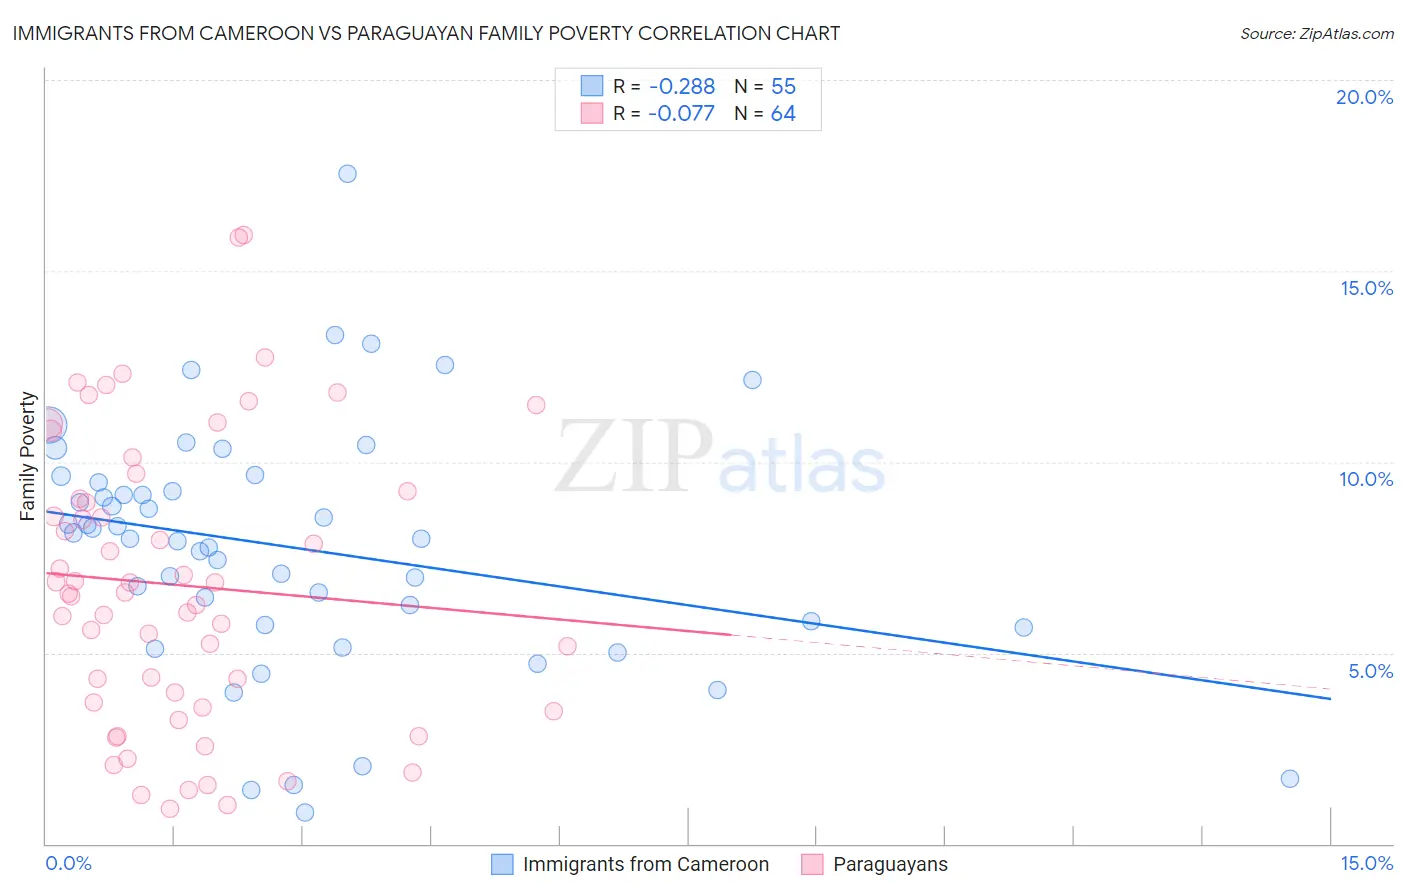
Immigrants from Cameroon vs Paraguayan Family Poverty Correlation Chart
The statistical analysis conducted on geographies consisting of 130,510,031 people shows a weak negative correlation between the proportion of Immigrants from Cameroon and poverty level among families in the United States with a correlation coefficient (R) of -0.288 and weighted average of 9.0%. Similarly, the statistical analysis conducted on geographies consisting of 95,035,993 people shows a slight negative correlation between the proportion of Paraguayans and poverty level among families in the United States with a correlation coefficient (R) of -0.077 and weighted average of 8.3%, a difference of 8.7%.
Family Poverty Correlation Summary
| Measurement | Immigrants from Cameroon | Paraguayan |
| Minimum | 0.83% | 0.93% |
| Maximum | 17.5% | 16.0% |
| Range | 16.7% | 15.0% |
| Mean | 7.8% | 6.8% |
| Median | 8.0% | 6.6% |
| Interquartile 25% (IQ1) | 5.7% | 3.6% |
| Interquartile 75% (IQ3) | 9.5% | 9.1% |
| Interquartile Range (IQR) | 3.7% | 5.5% |
| Standard Deviation (Sample) | 3.2% | 3.7% |
| Standard Deviation (Population) | 3.2% | 3.7% |
Similar Demographics by Family Poverty
Demographics Similar to Immigrants from Cameroon by Family Poverty
In terms of family poverty, the demographic groups most similar to Immigrants from Cameroon are Hawaiian (9.0%, a difference of 0.010%), Immigrants from Syria (9.0%, a difference of 0.040%), Costa Rican (9.0%, a difference of 0.28%), Immigrants from Iraq (9.1%, a difference of 0.36%), and Immigrants from Albania (9.0%, a difference of 0.37%).
| Demographics | Rating | Rank | Family Poverty |
| Lebanese | 57.6 /100 | #171 | Average 8.9% |
| Immigrants | Peru | 57.5 /100 | #172 | Average 8.9% |
| Immigrants | Fiji | 56.4 /100 | #173 | Average 8.9% |
| Immigrants | Albania | 50.0 /100 | #174 | Average 9.0% |
| Costa Ricans | 49.3 /100 | #175 | Average 9.0% |
| Immigrants | Syria | 47.5 /100 | #176 | Average 9.0% |
| Hawaiians | 47.2 /100 | #177 | Average 9.0% |
| Immigrants | Cameroon | 47.1 /100 | #178 | Average 9.0% |
| Immigrants | Iraq | 44.4 /100 | #179 | Average 9.1% |
| Immigrants | Uganda | 43.4 /100 | #180 | Average 9.1% |
| Hmong | 40.2 /100 | #181 | Average 9.1% |
| Immigrants | Morocco | 40.2 /100 | #182 | Average 9.1% |
| Uruguayans | 39.2 /100 | #183 | Fair 9.1% |
| South American Indians | 38.7 /100 | #184 | Fair 9.1% |
| Immigrants | Saudi Arabia | 38.6 /100 | #185 | Fair 9.1% |
Demographics Similar to Paraguayans by Family Poverty
In terms of family poverty, the demographic groups most similar to Paraguayans are Native Hawaiian (8.3%, a difference of 0.010%), Palestinian (8.3%, a difference of 0.070%), Soviet Union (8.3%, a difference of 0.17%), Immigrants from Egypt (8.3%, a difference of 0.18%), and Pakistani (8.3%, a difference of 0.21%).
| Demographics | Rating | Rank | Family Poverty |
| Immigrants | Israel | 93.5 /100 | #115 | Exceptional 8.2% |
| South Africans | 93.4 /100 | #116 | Exceptional 8.2% |
| Immigrants | Russia | 93.2 /100 | #117 | Exceptional 8.2% |
| Immigrants | Western Europe | 92.9 /100 | #118 | Exceptional 8.2% |
| French | 92.8 /100 | #119 | Exceptional 8.3% |
| Immigrants | Egypt | 91.6 /100 | #120 | Exceptional 8.3% |
| Native Hawaiians | 91.3 /100 | #121 | Exceptional 8.3% |
| Paraguayans | 91.2 /100 | #122 | Exceptional 8.3% |
| Palestinians | 91.1 /100 | #123 | Exceptional 8.3% |
| Soviet Union | 90.8 /100 | #124 | Exceptional 8.3% |
| Pakistanis | 90.8 /100 | #125 | Exceptional 8.3% |
| Icelanders | 90.3 /100 | #126 | Exceptional 8.3% |
| Immigrants | Hungary | 89.9 /100 | #127 | Excellent 8.4% |
| Argentineans | 89.6 /100 | #128 | Excellent 8.4% |
| Portuguese | 89.2 /100 | #129 | Excellent 8.4% |