Scandinavian vs Costa Rican Divorced or Separated
COMPARE
Scandinavian
Costa Rican
Divorced or Separated
Divorced or Separated Comparison
Scandinavians
Costa Ricans
12.3%
DIVORCED OR SEPARATED
10.4/ 100
METRIC RATING
223rd/ 347
METRIC RANK
12.0%
DIVORCED OR SEPARATED
53.3/ 100
METRIC RATING
171st/ 347
METRIC RANK
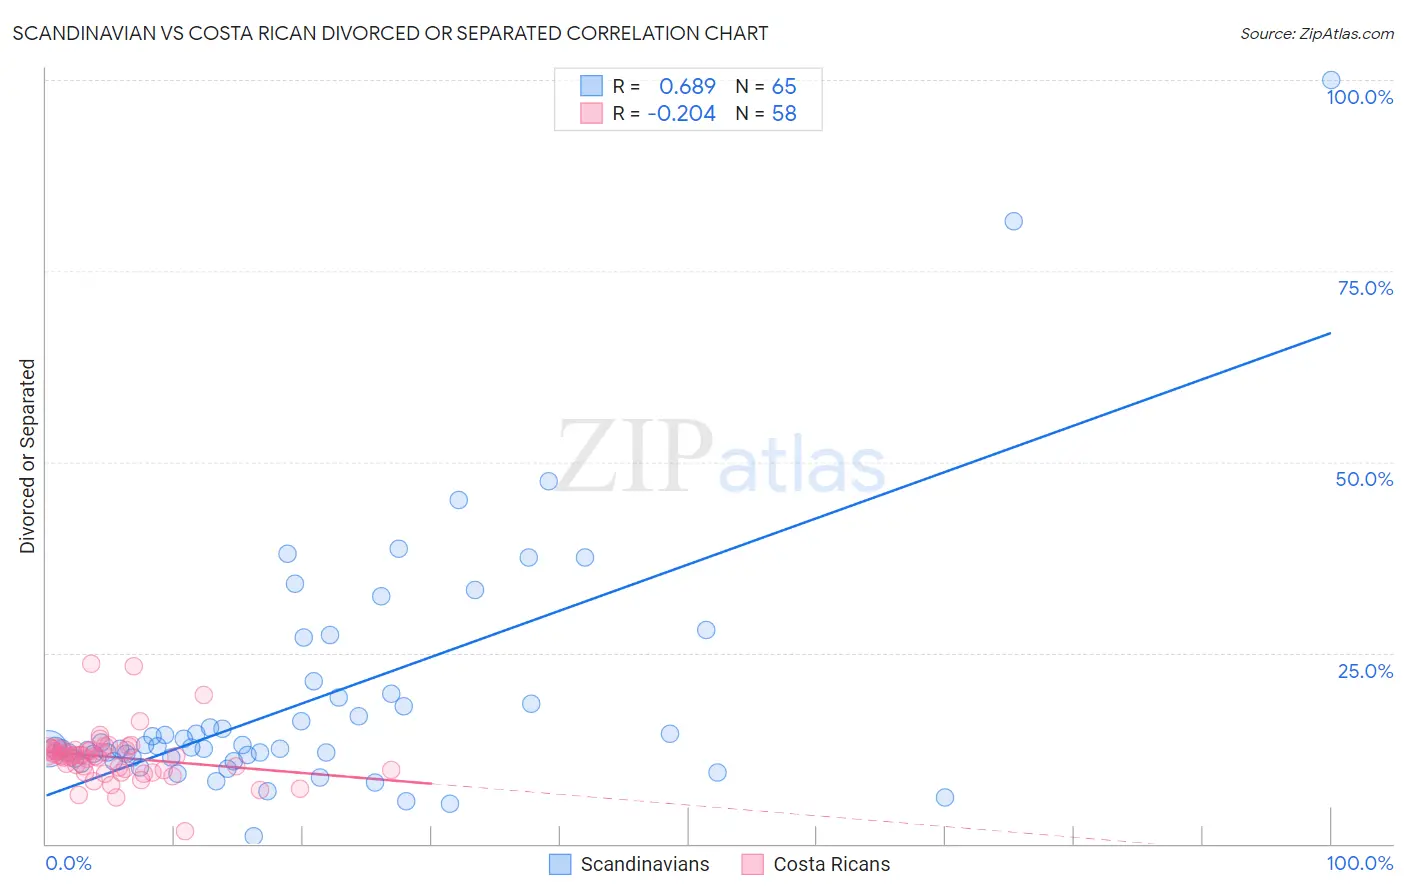
Scandinavian vs Costa Rican Divorced or Separated Correlation Chart
The statistical analysis conducted on geographies consisting of 472,421,001 people shows a significant positive correlation between the proportion of Scandinavians and percentage of population currently divorced or separated in the United States with a correlation coefficient (R) of 0.689 and weighted average of 12.3%. Similarly, the statistical analysis conducted on geographies consisting of 253,501,328 people shows a weak negative correlation between the proportion of Costa Ricans and percentage of population currently divorced or separated in the United States with a correlation coefficient (R) of -0.204 and weighted average of 12.0%, a difference of 2.0%.
Divorced or Separated Correlation Summary
| Measurement | Scandinavian | Costa Rican |
| Minimum | 1.0% | 1.7% |
| Maximum | 100.0% | 23.6% |
| Range | 99.0% | 21.9% |
| Mean | 18.9% | 11.3% |
| Median | 12.6% | 11.5% |
| Interquartile 25% (IQ1) | 11.2% | 9.6% |
| Interquartile 75% (IQ3) | 19.4% | 12.2% |
| Interquartile Range (IQR) | 8.2% | 2.6% |
| Standard Deviation (Sample) | 16.4% | 3.4% |
| Standard Deviation (Population) | 16.3% | 3.4% |
Similar Demographics by Divorced or Separated
Demographics Similar to Scandinavians by Divorced or Separated
In terms of divorced or separated, the demographic groups most similar to Scandinavians are Bangladeshi (12.3%, a difference of 0.010%), Immigrants from the Azores (12.3%, a difference of 0.070%), Belgian (12.3%, a difference of 0.070%), Guamanian/Chamorro (12.3%, a difference of 0.080%), and Immigrants from Western Africa (12.3%, a difference of 0.10%).
| Demographics | Rating | Rank | Divorced or Separated |
| Immigrants | South America | 15.4 /100 | #216 | Poor 12.2% |
| Northern Europeans | 14.7 /100 | #217 | Poor 12.2% |
| Slovenes | 13.2 /100 | #218 | Poor 12.3% |
| Czechoslovakians | 11.7 /100 | #219 | Poor 12.3% |
| British | 11.6 /100 | #220 | Poor 12.3% |
| Guamanians/Chamorros | 11.3 /100 | #221 | Poor 12.3% |
| Bangladeshis | 10.5 /100 | #222 | Poor 12.3% |
| Scandinavians | 10.4 /100 | #223 | Poor 12.3% |
| Immigrants | Azores | 9.7 /100 | #224 | Tragic 12.3% |
| Belgians | 9.7 /100 | #225 | Tragic 12.3% |
| Immigrants | Western Africa | 9.3 /100 | #226 | Tragic 12.3% |
| Hmong | 8.8 /100 | #227 | Tragic 12.3% |
| Immigrants | Cameroon | 8.3 /100 | #228 | Tragic 12.3% |
| Immigrants | Sudan | 8.2 /100 | #229 | Tragic 12.3% |
| Yakama | 7.8 /100 | #230 | Tragic 12.3% |
Demographics Similar to Costa Ricans by Divorced or Separated
In terms of divorced or separated, the demographic groups most similar to Costa Ricans are Immigrants from Mexico (12.0%, a difference of 0.010%), Mexican American Indian (12.0%, a difference of 0.090%), Immigrants from Moldova (12.1%, a difference of 0.10%), Hawaiian (12.1%, a difference of 0.12%), and Immigrants from Sierra Leone (12.1%, a difference of 0.12%).
| Demographics | Rating | Rank | Divorced or Separated |
| Swiss | 63.6 /100 | #164 | Good 12.0% |
| German Russians | 61.8 /100 | #165 | Good 12.0% |
| Tohono O'odham | 60.4 /100 | #166 | Good 12.0% |
| Ethiopians | 58.5 /100 | #167 | Average 12.0% |
| Serbians | 57.1 /100 | #168 | Average 12.0% |
| Immigrants | Peru | 57.0 /100 | #169 | Average 12.0% |
| Mexican American Indians | 55.8 /100 | #170 | Average 12.0% |
| Costa Ricans | 53.3 /100 | #171 | Average 12.0% |
| Immigrants | Mexico | 53.2 /100 | #172 | Average 12.0% |
| Immigrants | Moldova | 50.4 /100 | #173 | Average 12.1% |
| Hawaiians | 50.0 /100 | #174 | Average 12.1% |
| Immigrants | Sierra Leone | 50.0 /100 | #175 | Average 12.1% |
| Pennsylvania Germans | 48.9 /100 | #176 | Average 12.1% |
| Brazilians | 47.7 /100 | #177 | Average 12.1% |
| Ghanaians | 45.9 /100 | #178 | Average 12.1% |