Immigrants from the Azores vs Costa Rican Female Poverty
COMPARE
Immigrants from the Azores
Costa Rican
Female Poverty
Female Poverty Comparison
Immigrants from the Azores
Costa Ricans
14.2%
FEMALE POVERTY
7.9/ 100
METRIC RATING
208th/ 347
METRIC RANK
13.3%
FEMALE POVERTY
63.6/ 100
METRIC RATING
159th/ 347
METRIC RANK
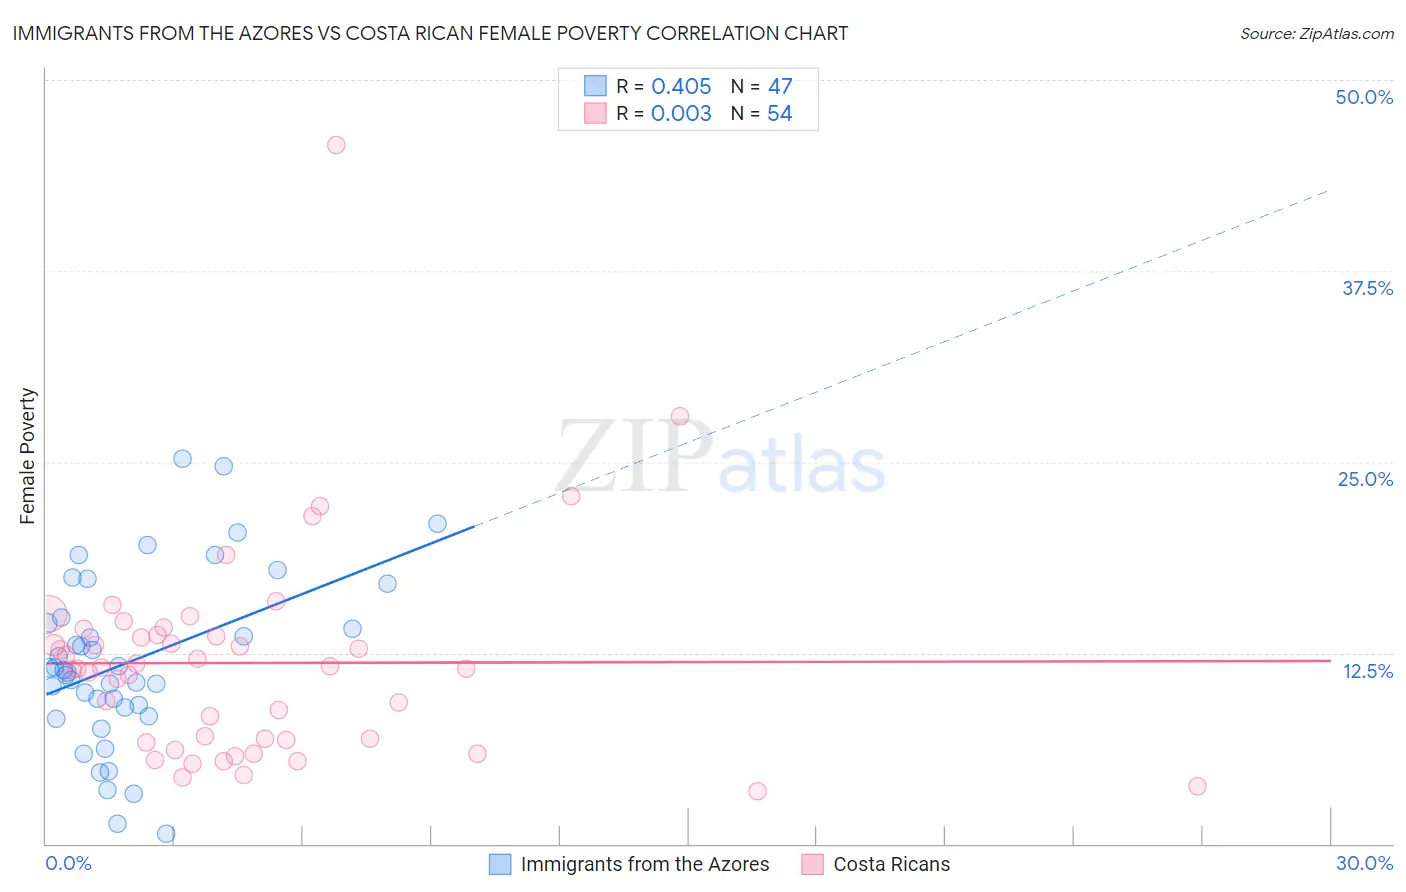
Immigrants from the Azores vs Costa Rican Female Poverty Correlation Chart
The statistical analysis conducted on geographies consisting of 46,244,959 people shows a moderate positive correlation between the proportion of Immigrants from the Azores and poverty level among females in the United States with a correlation coefficient (R) of 0.405 and weighted average of 14.2%. Similarly, the statistical analysis conducted on geographies consisting of 253,437,784 people shows no correlation between the proportion of Costa Ricans and poverty level among females in the United States with a correlation coefficient (R) of 0.003 and weighted average of 13.3%, a difference of 7.4%.
Female Poverty Correlation Summary
| Measurement | Immigrants from the Azores | Costa Rican |
| Minimum | 0.65% | 3.4% |
| Maximum | 25.2% | 45.8% |
| Range | 24.5% | 42.4% |
| Mean | 12.0% | 11.8% |
| Median | 11.3% | 11.5% |
| Interquartile 25% (IQ1) | 8.9% | 6.8% |
| Interquartile 75% (IQ3) | 14.8% | 13.6% |
| Interquartile Range (IQR) | 5.9% | 6.8% |
| Standard Deviation (Sample) | 5.6% | 7.0% |
| Standard Deviation (Population) | 5.6% | 6.9% |
Similar Demographics by Female Poverty
Demographics Similar to Immigrants from the Azores by Female Poverty
In terms of female poverty, the demographic groups most similar to Immigrants from the Azores are Panamanian (14.2%, a difference of 0.060%), Malaysian (14.3%, a difference of 0.15%), Moroccan (14.3%, a difference of 0.23%), Immigrants from Eastern Africa (14.2%, a difference of 0.34%), and Bermudan (14.4%, a difference of 0.86%).
| Demographics | Rating | Rank | Female Poverty |
| Immigrants | Kenya | 21.1 /100 | #201 | Fair 13.9% |
| Hmong | 21.1 /100 | #202 | Fair 13.9% |
| Immigrants | Western Asia | 20.7 /100 | #203 | Fair 13.9% |
| Spaniards | 18.9 /100 | #204 | Poor 13.9% |
| Ugandans | 15.4 /100 | #205 | Poor 14.0% |
| Immigrants | Uruguay | 14.0 /100 | #206 | Poor 14.0% |
| Immigrants | Eastern Africa | 9.0 /100 | #207 | Tragic 14.2% |
| Immigrants | Azores | 7.9 /100 | #208 | Tragic 14.2% |
| Panamanians | 7.7 /100 | #209 | Tragic 14.2% |
| Malaysians | 7.4 /100 | #210 | Tragic 14.3% |
| Moroccans | 7.2 /100 | #211 | Tragic 14.3% |
| Bermudans | 5.5 /100 | #212 | Tragic 14.4% |
| Alaskan Athabascans | 5.3 /100 | #213 | Tragic 14.4% |
| Marshallese | 5.0 /100 | #214 | Tragic 14.4% |
| Immigrants | Panama | 4.7 /100 | #215 | Tragic 14.4% |
Demographics Similar to Costa Ricans by Female Poverty
In terms of female poverty, the demographic groups most similar to Costa Ricans are Immigrants from Nepal (13.3%, a difference of 0.090%), Immigrants from Ethiopia (13.3%, a difference of 0.12%), Guamanian/Chamorro (13.3%, a difference of 0.12%), Immigrants from Albania (13.3%, a difference of 0.13%), and Ethiopian (13.3%, a difference of 0.14%).
| Demographics | Rating | Rank | Female Poverty |
| Samoans | 73.6 /100 | #152 | Good 13.1% |
| Immigrants | Fiji | 71.0 /100 | #153 | Good 13.2% |
| Armenians | 70.4 /100 | #154 | Good 13.2% |
| Hungarians | 70.1 /100 | #155 | Good 13.2% |
| Immigrants | Bosnia and Herzegovina | 69.7 /100 | #156 | Good 13.2% |
| Immigrants | Northern Africa | 68.8 /100 | #157 | Good 13.2% |
| Pennsylvania Germans | 67.3 /100 | #158 | Good 13.2% |
| Costa Ricans | 63.6 /100 | #159 | Good 13.3% |
| Immigrants | Nepal | 62.7 /100 | #160 | Good 13.3% |
| Immigrants | Ethiopia | 62.5 /100 | #161 | Good 13.3% |
| Guamanians/Chamorros | 62.4 /100 | #162 | Good 13.3% |
| Immigrants | Albania | 62.4 /100 | #163 | Good 13.3% |
| Ethiopians | 62.3 /100 | #164 | Good 13.3% |
| Scotch-Irish | 62.1 /100 | #165 | Good 13.3% |
| Immigrants | Oceania | 59.7 /100 | #166 | Average 13.3% |