Russian vs Cuban Poverty
COMPARE
Russian
Cuban
Poverty
Poverty Comparison
Russians
Cubans
10.9%
POVERTY
99.3/ 100
METRIC RATING
40th/ 347
METRIC RANK
13.9%
POVERTY
0.6/ 100
METRIC RATING
235th/ 347
METRIC RANK
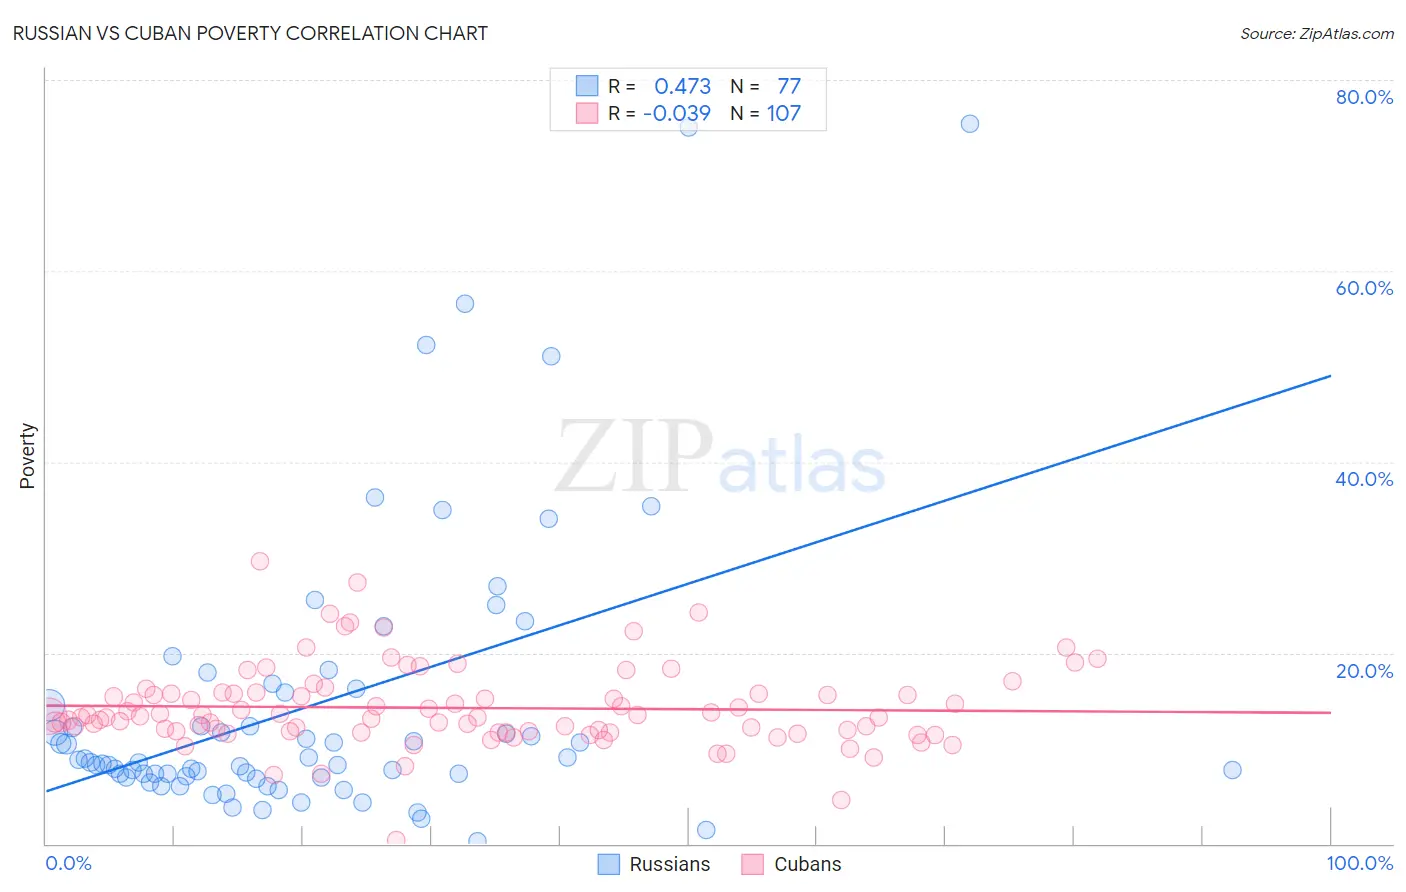
Russian vs Cuban Poverty Correlation Chart
The statistical analysis conducted on geographies consisting of 511,663,419 people shows a moderate positive correlation between the proportion of Russians and poverty level in the United States with a correlation coefficient (R) of 0.473 and weighted average of 10.9%. Similarly, the statistical analysis conducted on geographies consisting of 448,978,860 people shows no correlation between the proportion of Cubans and poverty level in the United States with a correlation coefficient (R) of -0.039 and weighted average of 13.9%, a difference of 27.8%.
Poverty Correlation Summary
| Measurement | Russian | Cuban |
| Minimum | 0.31% | 0.38% |
| Maximum | 75.4% | 29.6% |
| Range | 75.1% | 29.3% |
| Mean | 14.6% | 14.2% |
| Median | 8.6% | 13.3% |
| Interquartile 25% (IQ1) | 7.0% | 11.8% |
| Interquartile 75% (IQ3) | 16.1% | 15.7% |
| Interquartile Range (IQR) | 9.1% | 4.0% |
| Standard Deviation (Sample) | 15.1% | 4.3% |
| Standard Deviation (Population) | 15.0% | 4.3% |
Similar Demographics by Poverty
Demographics Similar to Russians by Poverty
In terms of poverty, the demographic groups most similar to Russians are Immigrants from Pakistan (10.8%, a difference of 0.050%), Immigrants from Iran (10.9%, a difference of 0.090%), Czech (10.8%, a difference of 0.13%), Immigrants from Greece (10.8%, a difference of 0.18%), and Cypriot (10.8%, a difference of 0.27%).
| Demographics | Rating | Rank | Poverty |
| Macedonians | 99.4 /100 | #33 | Exceptional 10.8% |
| Immigrants | Poland | 99.4 /100 | #34 | Exceptional 10.8% |
| Tongans | 99.4 /100 | #35 | Exceptional 10.8% |
| Cypriots | 99.3 /100 | #36 | Exceptional 10.8% |
| Immigrants | Greece | 99.3 /100 | #37 | Exceptional 10.8% |
| Czechs | 99.3 /100 | #38 | Exceptional 10.8% |
| Immigrants | Pakistan | 99.3 /100 | #39 | Exceptional 10.8% |
| Russians | 99.3 /100 | #40 | Exceptional 10.9% |
| Immigrants | Iran | 99.2 /100 | #41 | Exceptional 10.9% |
| Koreans | 99.2 /100 | #42 | Exceptional 10.9% |
| Immigrants | Singapore | 99.2 /100 | #43 | Exceptional 10.9% |
| Immigrants | Moldova | 99.1 /100 | #44 | Exceptional 10.9% |
| Turks | 98.9 /100 | #45 | Exceptional 11.0% |
| Immigrants | Czechoslovakia | 98.9 /100 | #46 | Exceptional 11.0% |
| Immigrants | Romania | 98.9 /100 | #47 | Exceptional 11.0% |
Demographics Similar to Cubans by Poverty
In terms of poverty, the demographic groups most similar to Cubans are Immigrants from Armenia (13.9%, a difference of 0.040%), French American Indian (13.9%, a difference of 0.060%), Ghanaian (13.9%, a difference of 0.19%), Immigrants from Laos (13.8%, a difference of 0.44%), and Nicaraguan (13.9%, a difference of 0.54%).
| Demographics | Rating | Rank | Poverty |
| Immigrants | Nigeria | 1.7 /100 | #228 | Tragic 13.5% |
| Osage | 1.5 /100 | #229 | Tragic 13.6% |
| Alaskan Athabascans | 1.5 /100 | #230 | Tragic 13.6% |
| Nigerians | 1.4 /100 | #231 | Tragic 13.6% |
| Fijians | 0.8 /100 | #232 | Tragic 13.7% |
| Immigrants | Saudi Arabia | 0.8 /100 | #233 | Tragic 13.8% |
| Immigrants | Laos | 0.7 /100 | #234 | Tragic 13.8% |
| Cubans | 0.6 /100 | #235 | Tragic 13.9% |
| Immigrants | Armenia | 0.5 /100 | #236 | Tragic 13.9% |
| French American Indians | 0.5 /100 | #237 | Tragic 13.9% |
| Ghanaians | 0.5 /100 | #238 | Tragic 13.9% |
| Nicaraguans | 0.4 /100 | #239 | Tragic 13.9% |
| Immigrants | Middle Africa | 0.4 /100 | #240 | Tragic 14.0% |
| Salvadorans | 0.4 /100 | #241 | Tragic 14.0% |
| Ecuadorians | 0.4 /100 | #242 | Tragic 14.0% |