Bolivian vs Chilean Receiving Food Stamps

COMPARE

Bolivian
Race
Ancestry
AfghanAfricanAlaska NativeAlaskan AthabascanAlbanianAleutAlsatianAmericanApacheArabArapahoArgentineanArmenianAssyrian/Chaldean/SyriacAustralianAustrianBahamianBangladeshiBarbadianBasqueBelgianBelizeanBermudanBhutaneseBlackfeetBolivianBrazilianBritishBritish West IndianBulgarianBurmeseCajunCambodianCanadianCape VerdeanCarpatho RusynCelticCentral AmericanCentral American IndianCherokeeCheyenneChickasawChineseChippewaChoctawColombianColvilleComancheCosta RicanCreeCreekCroatianCrowCubanCypriotCzechCzechoslovakianDanishDelawareDominicanDutchDutch West IndianEastern EuropeanEcuadorianEgyptianEnglishEstonianEthiopianEuropeanFijianFilipinoFinnishFrenchFrench American IndianFrench CanadianGermanGerman RussianGhanaianGreekGuamanian/ChamorroGuatemalanGuyaneseHaitianHmongHonduranHopiHoumaHungarianIcelanderIndian (Asian)IndonesianInupiatIranianIraqiIrishIroquoisIsraeliItalianJamaicanJapaneseJordanianKenyanKiowaKoreanLaotianLatvianLebaneseLiberianLithuanianLumbeeLuxembourgerMacedonianMalaysianMalteseMarshalleseMenomineeMexicanMexican American IndianMongolianMoroccanNative HawaiianNavajoNepaleseNew ZealanderNicaraguanNigerianNorthern EuropeanNorwegianOkinawanOsageOttawaPaiutePakistaniPalestinianPanamanianParaguayanPennsylvania GermanPeruvianPimaPolishPortuguesePotawatomiPuebloPuerto RicanPuget Sound SalishRomanianRussianSalvadoranSamoanScandinavianScotch-IrishScottishSeminoleSenegaleseSerbianShoshoneSierra LeoneanSiouxSlavicSlovakSloveneSomaliSouth AfricanSouth AmericanSouth American IndianSoviet UnionSpaniardSpanishSpanish AmericanSpanish American IndianSri LankanSubsaharan AfricanSudaneseSwedishSwissSyrianTaiwaneseThaiTlingit-HaidaTohono O'OdhamTonganTrinidadian and TobagonianTsimshianTurkishU.S. Virgin IslanderUgandanUkrainianUruguayanUteVenezuelanVietnameseWelshWest IndianYakamaYaquiYugoslavianYumanYup'ikZimbabwean
Immigration
NonimmigrantsImmigrantsAfghanistanAfricaAlbaniaArgentinaArmeniaAsiaAustraliaAustriaBahamasBangladeshBarbadosBelarusBelgiumBelizeBoliviaBosnia and HerzegovinaBrazilBulgariaBurma/MyanmarCabo VerdeCambodiaCameroonCanadaCaribbeanCentral AmericaChileChinaColombiaCongoCosta RicaCroatiaCubaCzechoslovakiaDenmarkDominicaDominican RepublicEastern AfricaEastern AsiaEastern EuropeEcuadorEgyptEl SalvadorEnglandEritreaEthiopiaEuropeFijiFranceGermanyGhanaGreeceGrenadaGuatemalaGuyanaHaitiHondurasHong KongHungaryIndiaIndonesiaIranIraqIrelandIsraelItalyJamaicaJapanJordanKazakhstanKenyaKoreaKuwaitLaosLatin AmericaLatviaLebanonLiberiaLithuaniaMalaysiaMexicoMicronesiaMiddle AfricaMoldovaMoroccoNepalNetherlandsNicaraguaNigeriaNorth AmericaNorth MacedoniaNorthern AfricaNorthern EuropeNorwayOceaniaPakistanPanamaPeruPhilippinesPolandPortugalRomaniaRussiaSaudi ArabiaScotlandSenegalSerbiaSierra LeoneSingaporeSomaliaSouth AfricaSouth AmericaSouth Central AsiaSouth Eastern AsiaSouthern EuropeSpainSri LankaSt. Vincent and the GrenadinesSudanSwedenSwitzerlandSyriaTaiwanThailandTrinidad and TobagoTurkeyUgandaUkraineUruguayUzbekistanVenezuelaVietnamWest IndiesWestern AfricaWestern AsiaWestern EuropeYemenZaireZimbabweAzores
Chilean
Race
Ancestry
AfghanAfricanAlaska NativeAlaskan AthabascanAlbanianAleutAlsatianAmericanApacheArabArapahoArgentineanArmenianAssyrian/Chaldean/SyriacAustralianAustrianBahamianBangladeshiBarbadianBasqueBelgianBelizeanBermudanBhutaneseBlackfeetBrazilianBritishBritish West IndianBulgarianBurmeseCajunCambodianCanadianCape VerdeanCarpatho RusynCelticCentral AmericanCentral American IndianCherokeeCheyenneChickasawChileanChineseChippewaChoctawColombianColvilleComancheCosta RicanCreeCreekCroatianCrowCubanCypriotCzechCzechoslovakianDanishDelawareDominicanDutchDutch West IndianEastern EuropeanEcuadorianEgyptianEnglishEstonianEthiopianEuropeanFijianFilipinoFinnishFrenchFrench American IndianFrench CanadianGermanGerman RussianGhanaianGreekGuamanian/ChamorroGuatemalanGuyaneseHaitianHmongHonduranHopiHoumaHungarianIcelanderIndian (Asian)IndonesianInupiatIranianIraqiIrishIroquoisIsraeliItalianJamaicanJapaneseJordanianKenyanKiowaKoreanLaotianLatvianLebaneseLiberianLithuanianLumbeeLuxembourgerMacedonianMalaysianMalteseMarshalleseMenomineeMexicanMexican American IndianMongolianMoroccanNative HawaiianNavajoNepaleseNew ZealanderNicaraguanNigerianNorthern EuropeanNorwegianOkinawanOsageOttawaPaiutePakistaniPalestinianPanamanianParaguayanPennsylvania GermanPeruvianPimaPolishPortuguesePotawatomiPuebloPuerto RicanPuget Sound SalishRomanianRussianSalvadoranSamoanScandinavianScotch-IrishScottishSeminoleSenegaleseSerbianShoshoneSierra LeoneanSiouxSlavicSlovakSloveneSomaliSouth AfricanSouth AmericanSouth American IndianSoviet UnionSpaniardSpanishSpanish AmericanSpanish American IndianSri LankanSubsaharan AfricanSudaneseSwedishSwissSyrianTaiwaneseThaiTlingit-HaidaTohono O'OdhamTonganTrinidadian and TobagonianTsimshianTurkishU.S. Virgin IslanderUgandanUkrainianUruguayanUteVenezuelanVietnameseWelshWest IndianYakamaYaquiYugoslavianYumanYup'ikZimbabwean
Immigration
NonimmigrantsImmigrantsAfghanistanAfricaAlbaniaArgentinaArmeniaAsiaAustraliaAustriaBahamasBangladeshBarbadosBelarusBelgiumBelizeBoliviaBosnia and HerzegovinaBrazilBulgariaBurma/MyanmarCabo VerdeCambodiaCameroonCanadaCaribbeanCentral AmericaChileChinaColombiaCongoCosta RicaCroatiaCubaCzechoslovakiaDenmarkDominicaDominican RepublicEastern AfricaEastern AsiaEastern EuropeEcuadorEgyptEl SalvadorEnglandEritreaEthiopiaEuropeFijiFranceGermanyGhanaGreeceGrenadaGuatemalaGuyanaHaitiHondurasHong KongHungaryIndiaIndonesiaIranIraqIrelandIsraelItalyJamaicaJapanJordanKazakhstanKenyaKoreaKuwaitLaosLatin AmericaLatviaLebanonLiberiaLithuaniaMalaysiaMexicoMicronesiaMiddle AfricaMoldovaMoroccoNepalNetherlandsNicaraguaNigeriaNorth AmericaNorth MacedoniaNorthern AfricaNorthern EuropeNorwayOceaniaPakistanPanamaPeruPhilippinesPolandPortugalRomaniaRussiaSaudi ArabiaScotlandSenegalSerbiaSierra LeoneSingaporeSomaliaSouth AfricaSouth AmericaSouth Central AsiaSouth Eastern AsiaSouthern EuropeSpainSri LankaSt. Vincent and the GrenadinesSudanSwedenSwitzerlandSyriaTaiwanThailandTrinidad and TobagoTurkeyUgandaUkraineUruguayUzbekistanVenezuelaVietnamWest IndiesWestern AfricaWestern AsiaWestern EuropeYemenZaireZimbabweAzores
Receiving Food Stamps
Income
Poverty
Unemployment
Labor Participation
Family Structure
Vehicle Availability
Education Level
Disability

Receiving Food Stamps Comparison

Bolivians

Chileans

Exceptional
Excellent
9.3%
RECEIVING FOOD STAMPS
99.7/ 100
METRIC RATING
32nd/ 347
METRIC RANK
11.0%
RECEIVING FOOD STAMPS
86.2/ 100
METRIC RATING
142nd/ 347
METRIC RANK

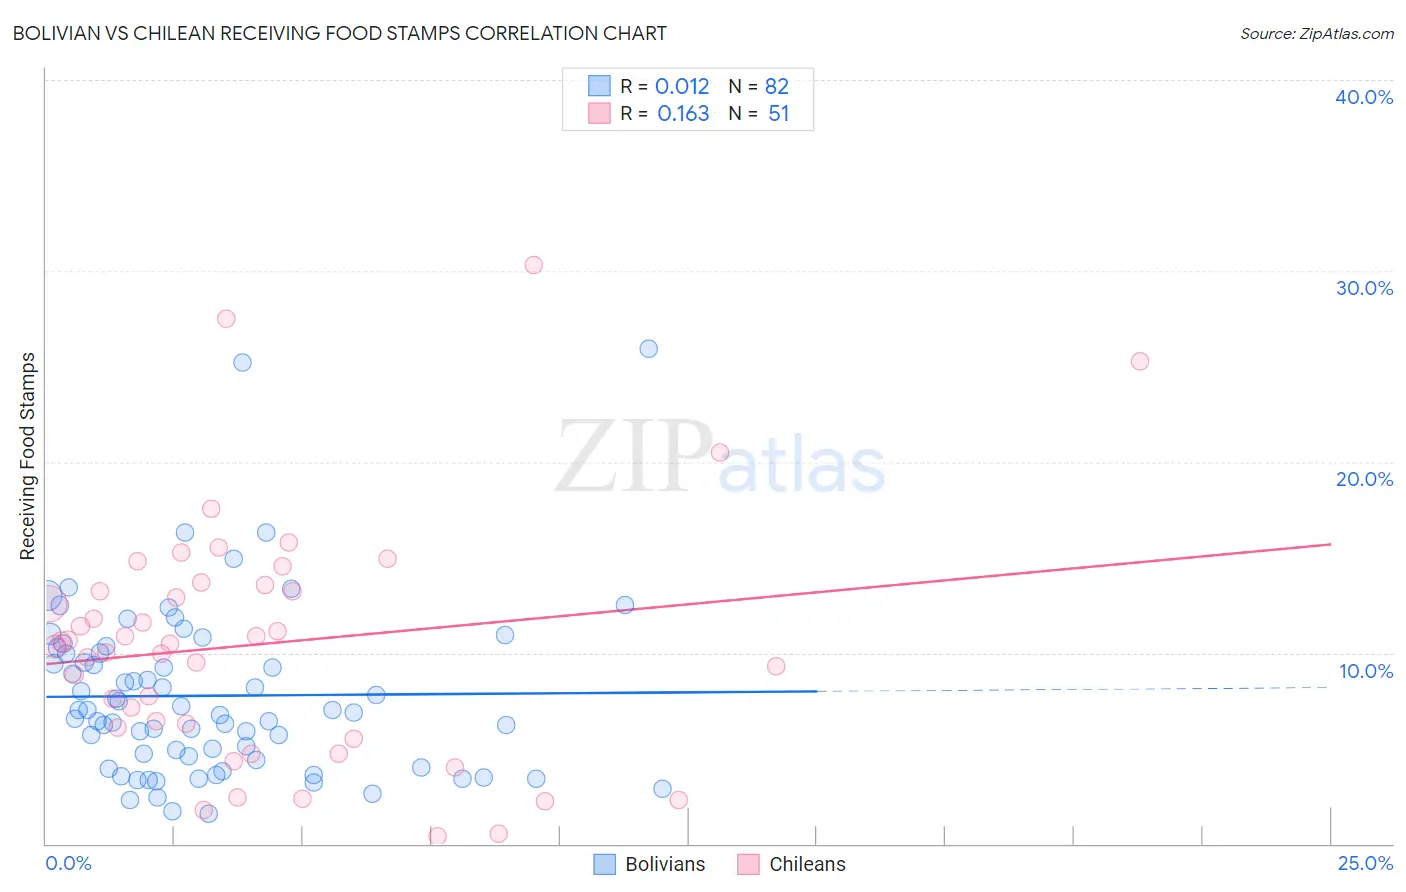
Bolivian vs Chilean Receiving Food Stamps Correlation Chart

The statistical analysis conducted on geographies consisting of 184,439,878 people shows no correlation between the proportion of Bolivians and percentage of population receiving government assistance and/or food stamps in the United States with a correlation coefficient (R) of 0.012 and weighted average of 9.3%. Similarly, the statistical analysis conducted on geographies consisting of 256,152,699 people shows a poor positive correlation between the proportion of Chileans and percentage of population receiving government assistance and/or food stamps in the United States with a correlation coefficient (R) of 0.163 and weighted average of 11.0%, a difference of 17.5%.
Bolivian vs Chilean Receiving Food Stamps

Receiving Food Stamps Correlation Summary

MeasurementBolivianChilean
Minimum1.6%0.40%
Maximum25.9%30.3%
Range24.3%29.9%
Mean7.8%10.5%
Median7.0%10.5%
Interquartile 25% (IQ1)4.4%6.1%
Interquartile 75% (IQ3)10.0%13.5%
Interquartile Range (IQR)5.6%7.4%
Standard Deviation (Sample)4.5%6.4%
Standard Deviation (Population)4.5%6.3%

Similar Demographics by Receiving Food Stamps

Demographics Similar to Bolivians by Receiving Food Stamps

In terms of receiving food stamps, the demographic groups most similar to Bolivians are Immigrants from Eastern Asia (9.3%, a difference of 0.31%), Immigrants from Sweden (9.3%, a difference of 0.72%), Immigrants from Lithuania (9.2%, a difference of 1.1%), Czech (9.2%, a difference of 1.4%), and Bhutanese (9.2%, a difference of 1.4%).
DemographicsRating | RankReceiving Food Stamps
Immigrants | Ireland
99.8
/100
|
#25
Exceptional
9.2%
Swedes
99.8
/100
|
#26
Exceptional
9.2%
Bhutanese
99.8
/100
|
#27
Exceptional
9.2%
Czechs
99.8
/100
|
#28
Exceptional
9.2%
Immigrants | Lithuania
99.8
/100
|
#29
Exceptional
9.2%
Immigrants | Sweden
99.7
/100
|
#30
Exceptional
9.3%
Immigrants | Eastern Asia
99.7
/100
|
#31
Exceptional
9.3%
Bolivians
99.7
/100
|
#32
Exceptional
9.3%
Zimbabweans
99.6
/100
|
#33
Exceptional
9.5%
Turks
99.6
/100
|
#34
Exceptional
9.5%
Immigrants | Austria
99.6
/100
|
#35
Exceptional
9.5%
Estonians
99.6
/100
|
#36
Exceptional
9.5%
Europeans
99.6
/100
|
#37
Exceptional
9.5%
Immigrants | Sri Lanka
99.5
/100
|
#38
Exceptional
9.5%
Immigrants | Bolivia
99.5
/100
|
#39
Exceptional
9.5%

Demographics Similar to Chileans by Receiving Food Stamps

In terms of receiving food stamps, the demographic groups most similar to Chileans are Immigrants from Northern Africa (11.0%, a difference of 0.080%), Immigrants from Vietnam (11.0%, a difference of 0.17%), Syrian (11.0%, a difference of 0.23%), Hungarian (11.0%, a difference of 0.35%), and Celtic (10.9%, a difference of 0.53%).
DemographicsRating | RankReceiving Food Stamps
Argentineans
90.2
/100
|
#135
Exceptional
10.8%
Slovaks
89.8
/100
|
#136
Excellent
10.8%
Immigrants | Eastern Europe
89.8
/100
|
#137
Excellent
10.8%
Immigrants | Moldova
88.5
/100
|
#138
Excellent
10.9%
Hmong
88.4
/100
|
#139
Excellent
10.9%
Celtics
87.8
/100
|
#140
Excellent
10.9%
Immigrants | Vietnam
86.7
/100
|
#141
Excellent
11.0%
Chileans
86.2
/100
|
#142
Excellent
11.0%
Immigrants | Northern Africa
86.0
/100
|
#143
Excellent
11.0%
Syrians
85.5
/100
|
#144
Excellent
11.0%
Hungarians
85.1
/100
|
#145
Excellent
11.0%
Taiwanese
84.2
/100
|
#146
Excellent
11.0%
Whites/Caucasians
83.9
/100
|
#147
Excellent
11.1%
Immigrants | South Eastern Asia
83.3
/100
|
#148
Excellent
11.1%
Brazilians
83.2
/100
|
#149
Excellent
11.1%