Iraqi vs Chilean Receiving Food Stamps
COMPARE
Iraqi
Chilean
Receiving Food Stamps
Receiving Food Stamps Comparison
Iraqis
Chileans
12.2%
RECEIVING FOOD STAMPS
26.6/ 100
METRIC RATING
196th/ 347
METRIC RANK
11.0%
RECEIVING FOOD STAMPS
86.2/ 100
METRIC RATING
142nd/ 347
METRIC RANK
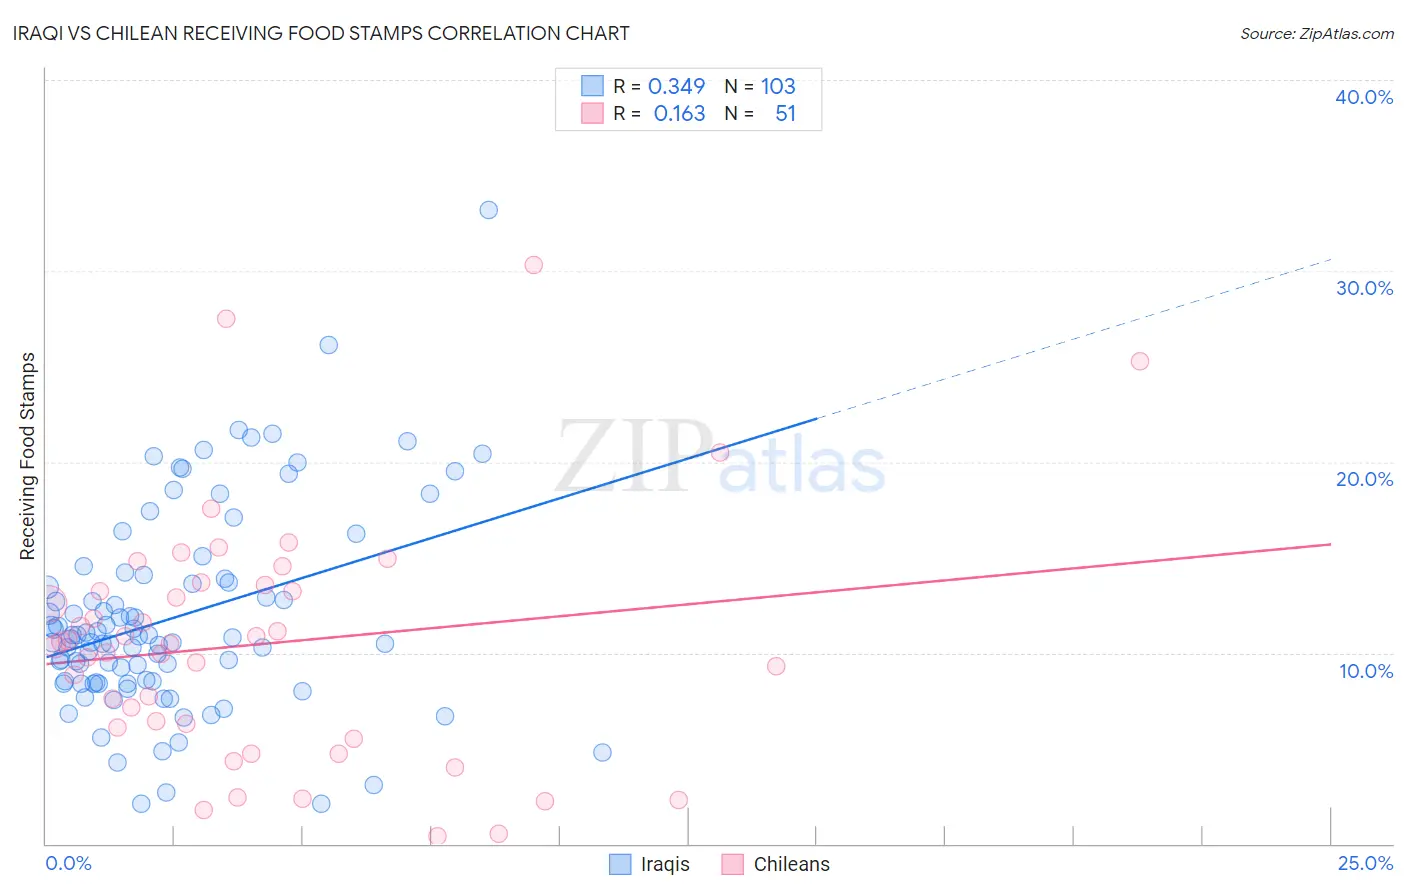
Iraqi vs Chilean Receiving Food Stamps Correlation Chart
The statistical analysis conducted on geographies consisting of 170,465,445 people shows a mild positive correlation between the proportion of Iraqis and percentage of population receiving government assistance and/or food stamps in the United States with a correlation coefficient (R) of 0.349 and weighted average of 12.2%. Similarly, the statistical analysis conducted on geographies consisting of 256,152,699 people shows a poor positive correlation between the proportion of Chileans and percentage of population receiving government assistance and/or food stamps in the United States with a correlation coefficient (R) of 0.163 and weighted average of 11.0%, a difference of 10.7%.
Receiving Food Stamps Correlation Summary
| Measurement | Iraqi | Chilean |
| Minimum | 2.1% | 0.40% |
| Maximum | 33.2% | 30.3% |
| Range | 31.1% | 29.9% |
| Mean | 11.8% | 10.5% |
| Median | 10.8% | 10.5% |
| Interquartile 25% (IQ1) | 8.4% | 6.1% |
| Interquartile 75% (IQ3) | 13.9% | 13.5% |
| Interquartile Range (IQR) | 5.5% | 7.4% |
| Standard Deviation (Sample) | 5.3% | 6.4% |
| Standard Deviation (Population) | 5.2% | 6.3% |
Similar Demographics by Receiving Food Stamps
Demographics Similar to Iraqis by Receiving Food Stamps
In terms of receiving food stamps, the demographic groups most similar to Iraqis are American (12.2%, a difference of 0.030%), Delaware (12.2%, a difference of 0.080%), Immigrants from Sudan (12.1%, a difference of 0.090%), Immigrants from Fiji (12.1%, a difference of 0.21%), and Immigrants from Costa Rica (12.2%, a difference of 0.21%).
| Demographics | Rating | Rank | Receiving Food Stamps |
| Immigrants | Cameroon | 32.5 /100 | #189 | Fair 12.0% |
| Immigrants | Peru | 32.2 /100 | #190 | Fair 12.0% |
| Venezuelans | 32.1 /100 | #191 | Fair 12.0% |
| Samoans | 31.0 /100 | #192 | Fair 12.1% |
| Immigrants | Fiji | 27.8 /100 | #193 | Fair 12.1% |
| Immigrants | Sudan | 27.1 /100 | #194 | Fair 12.1% |
| Americans | 26.7 /100 | #195 | Fair 12.2% |
| Iraqis | 26.6 /100 | #196 | Fair 12.2% |
| Delaware | 26.1 /100 | #197 | Fair 12.2% |
| Immigrants | Costa Rica | 25.4 /100 | #198 | Fair 12.2% |
| Portuguese | 25.1 /100 | #199 | Fair 12.2% |
| Sierra Leoneans | 23.6 /100 | #200 | Fair 12.2% |
| Ugandans | 22.5 /100 | #201 | Fair 12.2% |
| Immigrants | Venezuela | 20.1 /100 | #202 | Fair 12.3% |
| Shoshone | 17.7 /100 | #203 | Poor 12.4% |
Demographics Similar to Chileans by Receiving Food Stamps
In terms of receiving food stamps, the demographic groups most similar to Chileans are Immigrants from Northern Africa (11.0%, a difference of 0.080%), Immigrants from Vietnam (11.0%, a difference of 0.17%), Syrian (11.0%, a difference of 0.23%), Hungarian (11.0%, a difference of 0.35%), and Celtic (10.9%, a difference of 0.53%).
| Demographics | Rating | Rank | Receiving Food Stamps |
| Argentineans | 90.2 /100 | #135 | Exceptional 10.8% |
| Slovaks | 89.8 /100 | #136 | Excellent 10.8% |
| Immigrants | Eastern Europe | 89.8 /100 | #137 | Excellent 10.8% |
| Immigrants | Moldova | 88.5 /100 | #138 | Excellent 10.9% |
| Hmong | 88.4 /100 | #139 | Excellent 10.9% |
| Celtics | 87.8 /100 | #140 | Excellent 10.9% |
| Immigrants | Vietnam | 86.7 /100 | #141 | Excellent 11.0% |
| Chileans | 86.2 /100 | #142 | Excellent 11.0% |
| Immigrants | Northern Africa | 86.0 /100 | #143 | Excellent 11.0% |
| Syrians | 85.5 /100 | #144 | Excellent 11.0% |
| Hungarians | 85.1 /100 | #145 | Excellent 11.0% |
| Taiwanese | 84.2 /100 | #146 | Excellent 11.0% |
| Whites/Caucasians | 83.9 /100 | #147 | Excellent 11.1% |
| Immigrants | South Eastern Asia | 83.3 /100 | #148 | Excellent 11.1% |
| Brazilians | 83.2 /100 | #149 | Excellent 11.1% |