Puerto Rican vs Pakistani 2nd Grade
COMPARE
Puerto Rican
Pakistani
2nd Grade
2nd Grade Comparison
Puerto Ricans
Pakistanis
97.5%
2ND GRADE
0.7/ 100
METRIC RATING
253rd/ 347
METRIC RANK
97.8%
2ND GRADE
36.1/ 100
METRIC RATING
187th/ 347
METRIC RANK
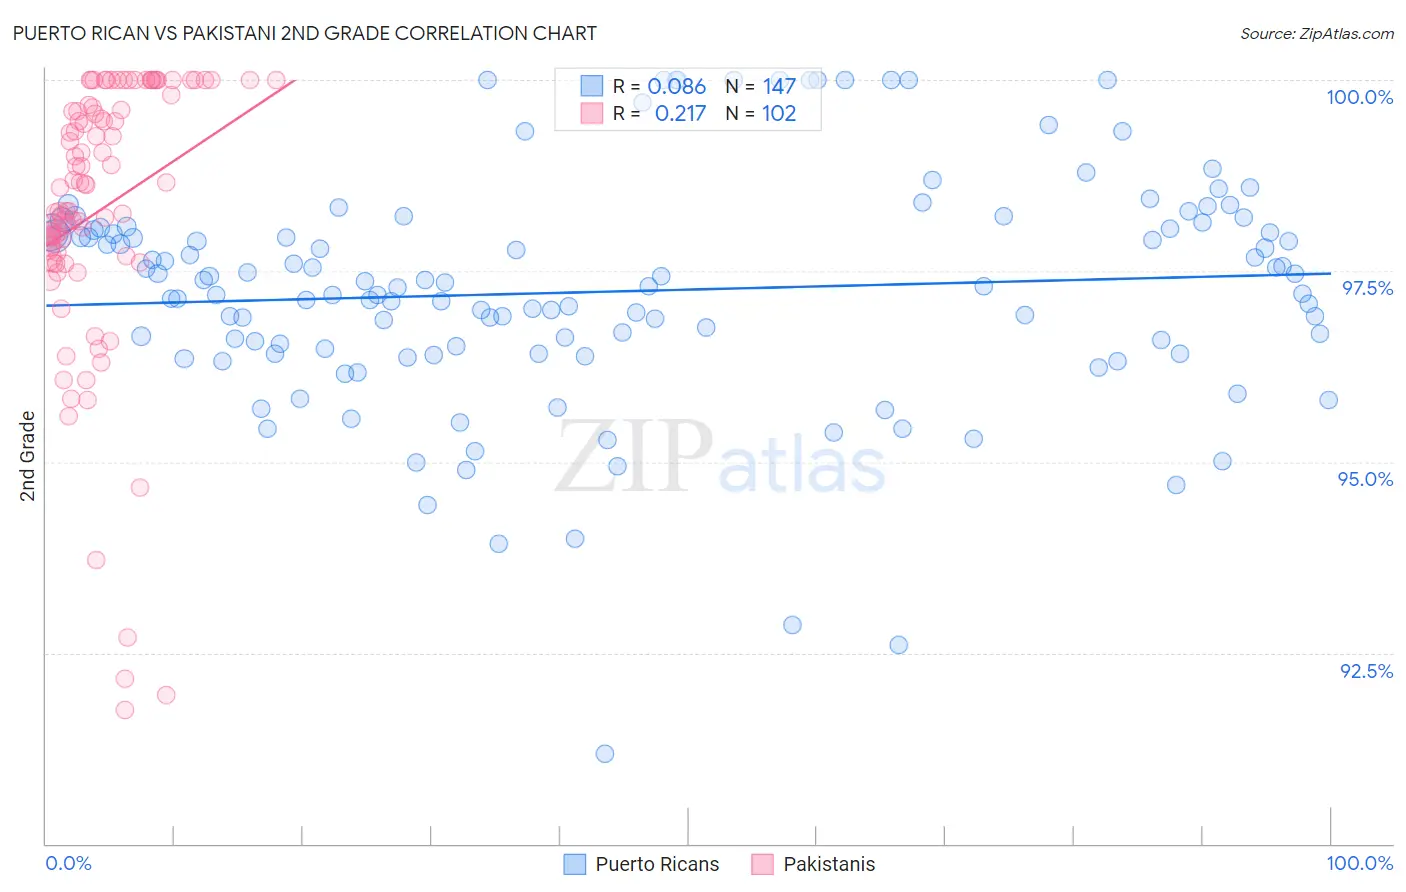
Puerto Rican vs Pakistani 2nd Grade Correlation Chart
The statistical analysis conducted on geographies consisting of 528,320,522 people shows a slight positive correlation between the proportion of Puerto Ricans and percentage of population with at least 2nd grade education in the United States with a correlation coefficient (R) of 0.086 and weighted average of 97.5%. Similarly, the statistical analysis conducted on geographies consisting of 335,355,426 people shows a weak positive correlation between the proportion of Pakistanis and percentage of population with at least 2nd grade education in the United States with a correlation coefficient (R) of 0.217 and weighted average of 97.8%, a difference of 0.35%.
2nd Grade Correlation Summary
| Measurement | Puerto Rican | Pakistani |
| Minimum | 91.2% | 91.8% |
| Maximum | 100.0% | 100.0% |
| Range | 8.8% | 8.2% |
| Mean | 97.2% | 98.3% |
| Median | 97.3% | 98.6% |
| Interquartile 25% (IQ1) | 96.4% | 97.7% |
| Interquartile 75% (IQ3) | 98.1% | 99.7% |
| Interquartile Range (IQR) | 1.6% | 2.0% |
| Standard Deviation (Sample) | 1.5% | 1.8% |
| Standard Deviation (Population) | 1.5% | 1.8% |
Similar Demographics by 2nd Grade
Demographics Similar to Puerto Ricans by 2nd Grade
In terms of 2nd grade, the demographic groups most similar to Puerto Ricans are Immigrants from Asia (97.5%, a difference of 0.0%), Immigrants from Africa (97.5%, a difference of 0.010%), Indian (Asian) (97.5%, a difference of 0.010%), Immigrants from Congo (97.5%, a difference of 0.010%), and South American (97.5%, a difference of 0.020%).
| Demographics | Rating | Rank | 2nd Grade |
| South Americans | 0.9 /100 | #246 | Tragic 97.5% |
| Immigrants | Senegal | 0.9 /100 | #247 | Tragic 97.5% |
| Immigrants | Middle Africa | 0.9 /100 | #248 | Tragic 97.5% |
| Bolivians | 0.9 /100 | #249 | Tragic 97.5% |
| Peruvians | 0.9 /100 | #250 | Tragic 97.5% |
| Immigrants | Africa | 0.8 /100 | #251 | Tragic 97.5% |
| Immigrants | Asia | 0.7 /100 | #252 | Tragic 97.5% |
| Puerto Ricans | 0.7 /100 | #253 | Tragic 97.5% |
| Indians (Asian) | 0.6 /100 | #254 | Tragic 97.5% |
| Immigrants | Congo | 0.6 /100 | #255 | Tragic 97.5% |
| Jamaicans | 0.6 /100 | #256 | Tragic 97.5% |
| Immigrants | Colombia | 0.5 /100 | #257 | Tragic 97.5% |
| Yaqui | 0.5 /100 | #258 | Tragic 97.5% |
| Fijians | 0.5 /100 | #259 | Tragic 97.5% |
| Assyrians/Chaldeans/Syriacs | 0.5 /100 | #260 | Tragic 97.5% |
Demographics Similar to Pakistanis by 2nd Grade
In terms of 2nd grade, the demographic groups most similar to Pakistanis are Arab (97.8%, a difference of 0.0%), Immigrants from Kazakhstan (97.8%, a difference of 0.0%), Panamanian (97.8%, a difference of 0.010%), Portuguese (97.8%, a difference of 0.020%), and Immigrants from Poland (97.8%, a difference of 0.020%).
| Demographics | Rating | Rank | 2nd Grade |
| Natives/Alaskans | 44.3 /100 | #180 | Average 97.9% |
| Egyptians | 44.3 /100 | #181 | Average 97.9% |
| Portuguese | 42.4 /100 | #182 | Average 97.8% |
| Immigrants | Poland | 42.2 /100 | #183 | Average 97.8% |
| Immigrants | Belarus | 41.5 /100 | #184 | Average 97.8% |
| Immigrants | Argentina | 40.6 /100 | #185 | Average 97.8% |
| Arabs | 36.9 /100 | #186 | Fair 97.8% |
| Pakistanis | 36.1 /100 | #187 | Fair 97.8% |
| Immigrants | Kazakhstan | 35.6 /100 | #188 | Fair 97.8% |
| Panamanians | 33.5 /100 | #189 | Fair 97.8% |
| Immigrants | Taiwan | 31.8 /100 | #190 | Fair 97.8% |
| Paraguayans | 30.8 /100 | #191 | Fair 97.8% |
| Blacks/African Americans | 29.9 /100 | #192 | Fair 97.8% |
| Hawaiians | 28.5 /100 | #193 | Fair 97.8% |
| Paiute | 27.0 /100 | #194 | Fair 97.8% |