Czechoslovakian vs Pakistani Single Mother Poverty
COMPARE
Czechoslovakian
Pakistani
Single Mother Poverty
Single Mother Poverty Comparison
Czechoslovakians
Pakistanis
29.7%
SINGLE MOTHER POVERTY
16.1/ 100
METRIC RATING
205th/ 347
METRIC RANK
28.0%
SINGLE MOTHER POVERTY
96.9/ 100
METRIC RATING
101st/ 347
METRIC RANK
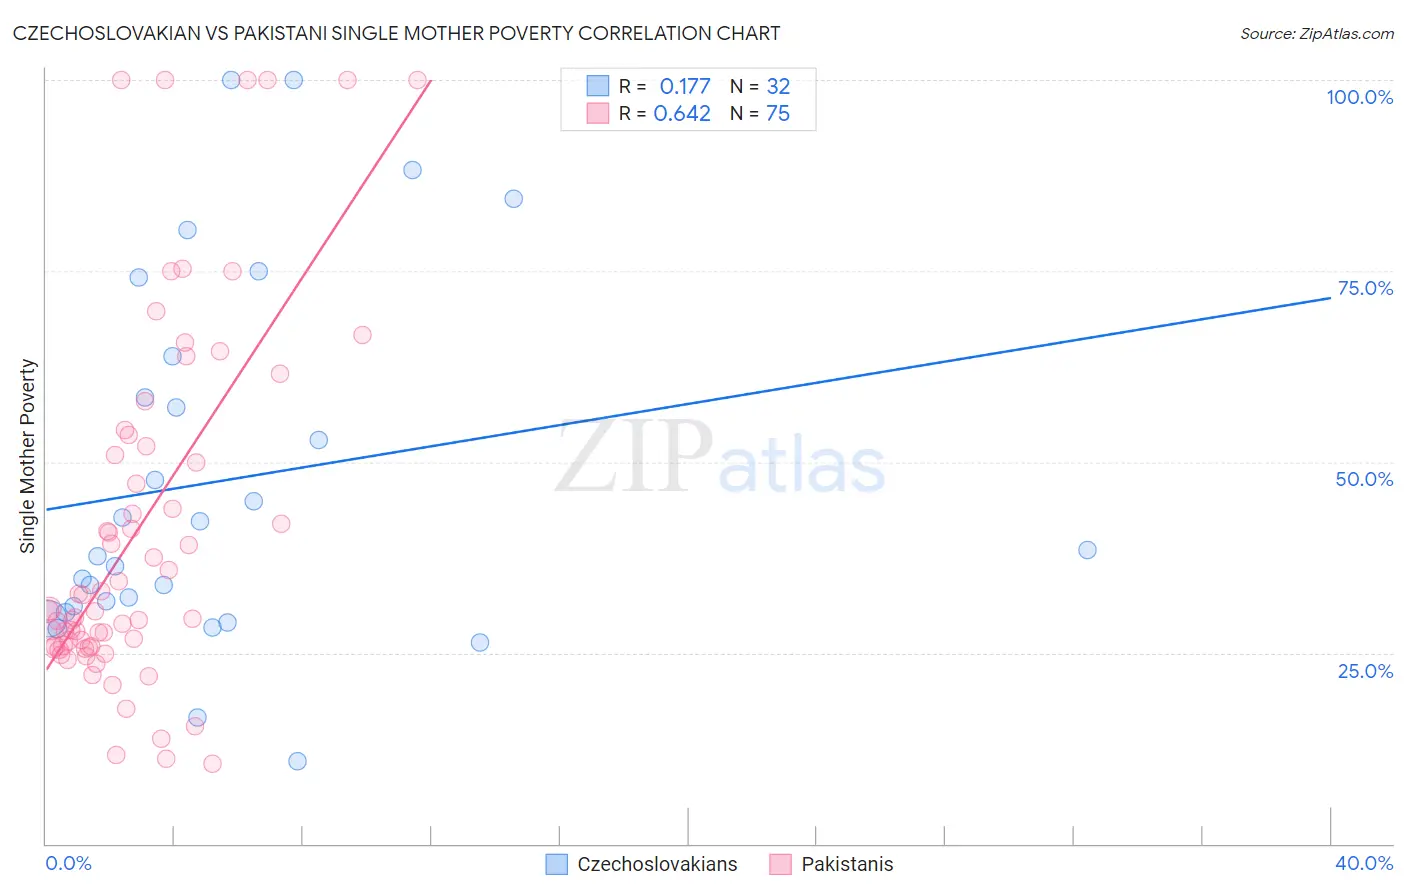
Czechoslovakian vs Pakistani Single Mother Poverty Correlation Chart
The statistical analysis conducted on geographies consisting of 358,570,470 people shows a poor positive correlation between the proportion of Czechoslovakians and poverty level among single mothers in the United States with a correlation coefficient (R) of 0.177 and weighted average of 29.7%. Similarly, the statistical analysis conducted on geographies consisting of 329,467,597 people shows a significant positive correlation between the proportion of Pakistanis and poverty level among single mothers in the United States with a correlation coefficient (R) of 0.642 and weighted average of 28.0%, a difference of 6.4%.
Single Mother Poverty Correlation Summary
| Measurement | Czechoslovakian | Pakistani |
| Minimum | 10.8% | 10.5% |
| Maximum | 100.0% | 100.0% |
| Range | 89.2% | 89.5% |
| Mean | 47.5% | 41.1% |
| Median | 38.1% | 30.5% |
| Interquartile 25% (IQ1) | 30.7% | 25.8% |
| Interquartile 75% (IQ3) | 61.2% | 52.0% |
| Interquartile Range (IQR) | 30.4% | 26.2% |
| Standard Deviation (Sample) | 23.9% | 23.5% |
| Standard Deviation (Population) | 23.5% | 23.3% |
Similar Demographics by Single Mother Poverty
Demographics Similar to Czechoslovakians by Single Mother Poverty
In terms of single mother poverty, the demographic groups most similar to Czechoslovakians are Immigrants from Haiti (29.7%, a difference of 0.020%), Immigrants (29.7%, a difference of 0.040%), Immigrants from Panama (29.8%, a difference of 0.050%), Swiss (29.7%, a difference of 0.10%), and Malaysian (29.7%, a difference of 0.11%).
| Demographics | Rating | Rank | Single Mother Poverty |
| Trinidadians and Tobagonians | 21.7 /100 | #198 | Fair 29.6% |
| Cubans | 20.8 /100 | #199 | Fair 29.6% |
| Panamanians | 20.0 /100 | #200 | Fair 29.6% |
| Belgians | 18.8 /100 | #201 | Poor 29.7% |
| Malaysians | 17.4 /100 | #202 | Poor 29.7% |
| Swiss | 17.2 /100 | #203 | Poor 29.7% |
| Immigrants | Immigrants | 16.6 /100 | #204 | Poor 29.7% |
| Czechoslovakians | 16.1 /100 | #205 | Poor 29.7% |
| Immigrants | Haiti | 15.8 /100 | #206 | Poor 29.7% |
| Immigrants | Panama | 15.5 /100 | #207 | Poor 29.8% |
| Immigrants | Guyana | 14.7 /100 | #208 | Poor 29.8% |
| Irish | 13.9 /100 | #209 | Poor 29.8% |
| Haitians | 13.3 /100 | #210 | Poor 29.8% |
| Guyanese | 12.8 /100 | #211 | Poor 29.8% |
| Nicaraguans | 12.4 /100 | #212 | Poor 29.8% |
Demographics Similar to Pakistanis by Single Mother Poverty
In terms of single mother poverty, the demographic groups most similar to Pakistanis are Zimbabwean (27.9%, a difference of 0.070%), Immigrants from Croatia (28.0%, a difference of 0.10%), Immigrants from Netherlands (27.9%, a difference of 0.11%), Immigrants from Nepal (27.9%, a difference of 0.12%), and Immigrants from Northern Africa (28.0%, a difference of 0.12%).
| Demographics | Rating | Rank | Single Mother Poverty |
| Albanians | 97.6 /100 | #94 | Exceptional 27.9% |
| Chileans | 97.5 /100 | #95 | Exceptional 27.9% |
| Immigrants | Iraq | 97.3 /100 | #96 | Exceptional 27.9% |
| Immigrants | Brazil | 97.2 /100 | #97 | Exceptional 27.9% |
| Immigrants | Nepal | 97.2 /100 | #98 | Exceptional 27.9% |
| Immigrants | Netherlands | 97.2 /100 | #99 | Exceptional 27.9% |
| Zimbabweans | 97.1 /100 | #100 | Exceptional 27.9% |
| Pakistanis | 96.9 /100 | #101 | Exceptional 28.0% |
| Immigrants | Croatia | 96.7 /100 | #102 | Exceptional 28.0% |
| Immigrants | Northern Africa | 96.6 /100 | #103 | Exceptional 28.0% |
| Italians | 96.6 /100 | #104 | Exceptional 28.0% |
| Israelis | 96.5 /100 | #105 | Exceptional 28.0% |
| Ukrainians | 96.4 /100 | #106 | Exceptional 28.0% |
| Immigrants | Venezuela | 95.8 /100 | #107 | Exceptional 28.1% |
| Immigrants | Zimbabwe | 95.5 /100 | #108 | Exceptional 28.1% |