Taiwanese vs Pakistani Single Mother Poverty
COMPARE
Taiwanese
Pakistani
Single Mother Poverty
Single Mother Poverty Comparison
Taiwanese
Pakistanis
27.5%
SINGLE MOTHER POVERTY
99.1/ 100
METRIC RATING
80th/ 347
METRIC RANK
28.0%
SINGLE MOTHER POVERTY
96.9/ 100
METRIC RATING
101st/ 347
METRIC RANK
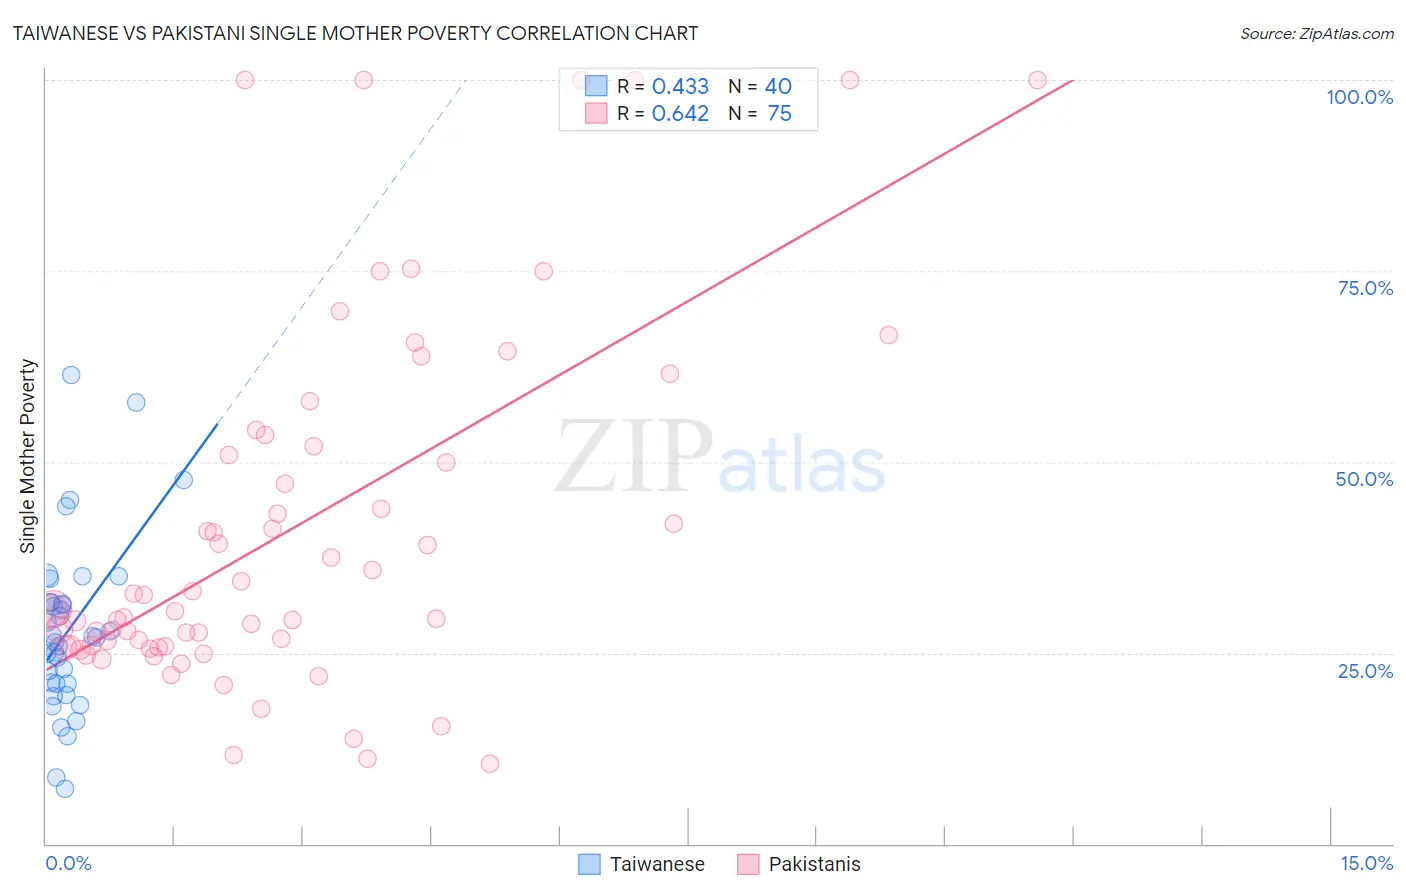
Taiwanese vs Pakistani Single Mother Poverty Correlation Chart
The statistical analysis conducted on geographies consisting of 31,572,043 people shows a moderate positive correlation between the proportion of Taiwanese and poverty level among single mothers in the United States with a correlation coefficient (R) of 0.433 and weighted average of 27.5%. Similarly, the statistical analysis conducted on geographies consisting of 329,467,597 people shows a significant positive correlation between the proportion of Pakistanis and poverty level among single mothers in the United States with a correlation coefficient (R) of 0.642 and weighted average of 28.0%, a difference of 1.6%.
Single Mother Poverty Correlation Summary
| Measurement | Taiwanese | Pakistani |
| Minimum | 7.1% | 10.5% |
| Maximum | 61.3% | 100.0% |
| Range | 54.2% | 89.5% |
| Mean | 28.1% | 41.1% |
| Median | 27.1% | 30.5% |
| Interquartile 25% (IQ1) | 21.0% | 25.8% |
| Interquartile 75% (IQ3) | 31.6% | 52.0% |
| Interquartile Range (IQR) | 10.7% | 26.2% |
| Standard Deviation (Sample) | 11.4% | 23.5% |
| Standard Deviation (Population) | 11.3% | 23.3% |
Similar Demographics by Single Mother Poverty
Demographics Similar to Taiwanese by Single Mother Poverty
In terms of single mother poverty, the demographic groups most similar to Taiwanese are Immigrants from Italy (27.5%, a difference of 0.0%), Immigrants from North Macedonia (27.5%, a difference of 0.040%), Immigrants from Peru (27.5%, a difference of 0.050%), Peruvian (27.5%, a difference of 0.070%), and Immigrants from Sweden (27.5%, a difference of 0.11%).
| Demographics | Rating | Rank | Single Mother Poverty |
| Sierra Leoneans | 99.3 /100 | #73 | Exceptional 27.4% |
| Immigrants | Europe | 99.3 /100 | #74 | Exceptional 27.4% |
| Immigrants | Sweden | 99.2 /100 | #75 | Exceptional 27.5% |
| Peruvians | 99.2 /100 | #76 | Exceptional 27.5% |
| Immigrants | Peru | 99.2 /100 | #77 | Exceptional 27.5% |
| Immigrants | North Macedonia | 99.2 /100 | #78 | Exceptional 27.5% |
| Immigrants | Italy | 99.1 /100 | #79 | Exceptional 27.5% |
| Taiwanese | 99.1 /100 | #80 | Exceptional 27.5% |
| Immigrants | Scotland | 98.9 /100 | #81 | Exceptional 27.6% |
| Immigrants | Cameroon | 98.8 /100 | #82 | Exceptional 27.6% |
| Greeks | 98.7 /100 | #83 | Exceptional 27.7% |
| Immigrants | Latvia | 98.7 /100 | #84 | Exceptional 27.7% |
| Mongolians | 98.7 /100 | #85 | Exceptional 27.7% |
| Immigrants | Ukraine | 98.6 /100 | #86 | Exceptional 27.7% |
| Afghans | 98.5 /100 | #87 | Exceptional 27.7% |
Demographics Similar to Pakistanis by Single Mother Poverty
In terms of single mother poverty, the demographic groups most similar to Pakistanis are Zimbabwean (27.9%, a difference of 0.070%), Immigrants from Croatia (28.0%, a difference of 0.10%), Immigrants from Netherlands (27.9%, a difference of 0.11%), Immigrants from Nepal (27.9%, a difference of 0.12%), and Immigrants from Northern Africa (28.0%, a difference of 0.12%).
| Demographics | Rating | Rank | Single Mother Poverty |
| Albanians | 97.6 /100 | #94 | Exceptional 27.9% |
| Chileans | 97.5 /100 | #95 | Exceptional 27.9% |
| Immigrants | Iraq | 97.3 /100 | #96 | Exceptional 27.9% |
| Immigrants | Brazil | 97.2 /100 | #97 | Exceptional 27.9% |
| Immigrants | Nepal | 97.2 /100 | #98 | Exceptional 27.9% |
| Immigrants | Netherlands | 97.2 /100 | #99 | Exceptional 27.9% |
| Zimbabweans | 97.1 /100 | #100 | Exceptional 27.9% |
| Pakistanis | 96.9 /100 | #101 | Exceptional 28.0% |
| Immigrants | Croatia | 96.7 /100 | #102 | Exceptional 28.0% |
| Immigrants | Northern Africa | 96.6 /100 | #103 | Exceptional 28.0% |
| Italians | 96.6 /100 | #104 | Exceptional 28.0% |
| Israelis | 96.5 /100 | #105 | Exceptional 28.0% |
| Ukrainians | 96.4 /100 | #106 | Exceptional 28.0% |
| Immigrants | Venezuela | 95.8 /100 | #107 | Exceptional 28.1% |
| Immigrants | Zimbabwe | 95.5 /100 | #108 | Exceptional 28.1% |